A Fibonacci Extension is a popular technical analysis tool used by traders to identify potential price targets and resistance or support levels once a prevailing trend resumes. It extends beyond traditional retracement levels typically beyond 100% of a prior price move to estimate where price movements may reach in the future.
Derived from the Fibonacci sequence, Fibonacci Extensions (often called “Fib Extensions”) rely on mathematical ratios such as 127.2%, 161.8%, 261.8%, and 423.6%. These levels represent projected areas where prices might pause, reverse, or consolidate during a continuation of an existing trend.
Click Here To Join our Telegram Community
In essence, while Fibonacci retracements help traders identify potential pullback zones within a trend, Fibonacci extensions project possible future levels where the next price move could face resistance (in an uptrend) or support (in a downtrend).
Understanding the Concept of Fibonacci Ratios
To grasp Fibonacci Extensions, it’s essential to understand their mathematical foundation. The Fibonacci sequence is a series of numbers starting from 0 and 1, where each subsequent number is the sum of the previous two:
0, 1, 1, 2, 3, 5, 8, 13, 21, 34, 55, 89, 144 …
From this sequence, a unique set of ratios emerges. As the numbers increase, specific relationships between them form the basis of Fibonacci analysis in trading:
- 61.8% (Golden Ratio) – Obtained by dividing a number by the next higher number (e.g., 34 ÷ 55 = 0.618).
- 161.8% – Found by dividing a number by the preceding number (e.g., 55 ÷ 34 = 1.618).
- 261.8% – Derived by dividing a number by the one two places before (e.g., 55 ÷ 21 = 2.619).
- 423.6% – Found by dividing a number by the one three places before (e.g., 89 ÷ 21 = 4.238).
These ratios, along with their derivatives such as 127.2% (the square root of 1.618), serve as extension levels on a price chart.
How Fibonacci Extensions Work
The Fibonacci Extensions project possible future price levels by applying these ratios to a significant price move and its subsequent retracement.
Here’s how they work in practice:
- Identify the Dominant Trend
Determine whether the market is in an uptrend or a downtrend. This is done by analyzing higher highs and higher lows (uptrend) or lower highs and lower lows (downtrend). - Mark Key Price Swings
Choose three points on the price chart:- Point 1: The start of the move (the swing low in an uptrend or swing high in a downtrend)
- Point 2: The end of the move (the swing high in an uptrend or swing low in a downtrend)
- Point 3: The retracement level where the pullback ends and the trend resumes
- Apply the Fibonacci Extension Tool
Using charting software (like MetaTrader, TradingView, or ThinkorSwim), apply the Fibonacci Extension tool using these three points. - Interpret Extension Levels
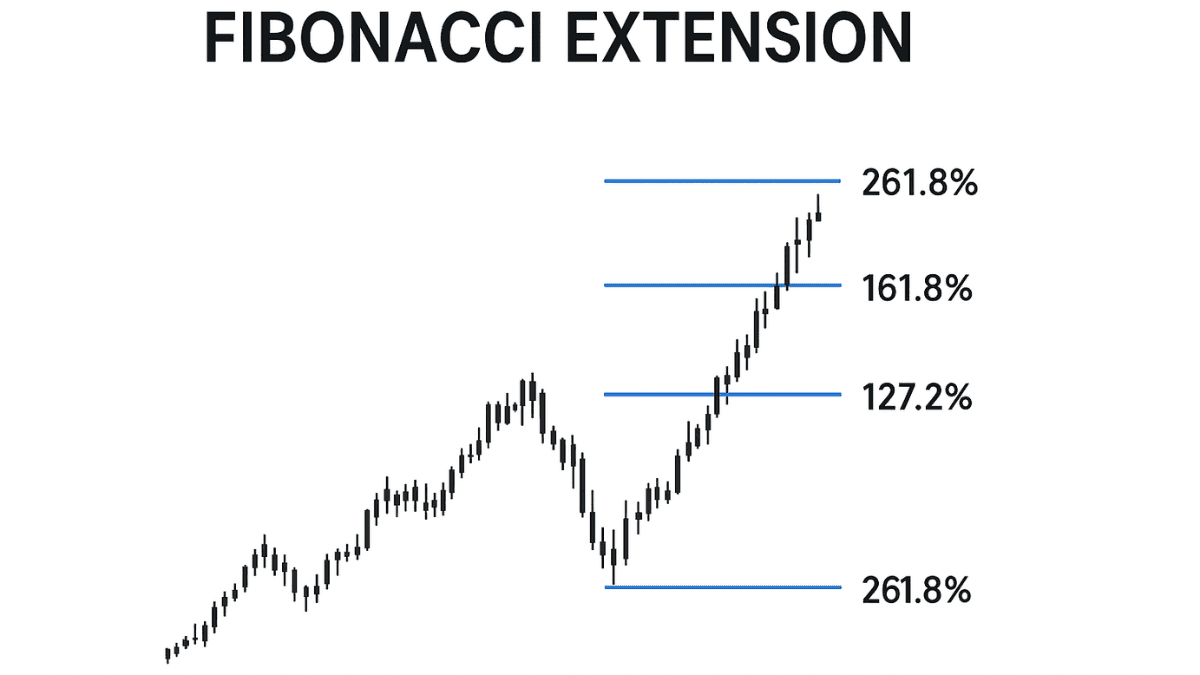
The tool plots horizontal lines representing extension ratios such as 127.2%, 161.8%, 261.8%, and 423.6%. These lines suggest potential price targets or areas of interest for taking profit or placing stop-loss orders.
Example of Fibonacci Extension in Trading
Imagine a currency pair in an uptrend:
- The price moves from $1.2000 (swing low) to $1.2500 (swing high) — a 500-pip rise.
- The price then retraces to $1.2300 before moving higher again.
Using Fibonacci Extensions, traders can project potential resistance levels:
- 127.2% level: $1.2000 + (500 × 1.272) = $1.2360 + 636 = $1.2636
- 161.8% level: $1.2000 + (500 × 1.618) = $1.2809
- 261.8% level: $1.2000 + (500 × 2.618) = $1.3309
These projected levels help traders set profit targets or anticipate reversal zones.
Key Fibonacci Extension Levels and Their Significance
| Extension Level | Ratio | Interpretation |
| 127.2% | √1.618 | Early projection or moderate extension target |
| 161.8% | Golden ratio | Most commonly used extension target |
| 261.8% | 1.618² | Strong trend continuation target |
| 423.6% | 1.618 + 2.618 | Extreme extension level, rare but significant |
Among these, the 161.8% level is often seen as the most crucial in determining where a trend may pause or reverse.
Fibonacci Extension vs. Fibonacci Retracement
| Aspect | Fibonacci Retracement | Fibonacci Extension |
| Purpose | Identifies where a price may pull back during a trend | Identifies where the price may reach after the trend resumes |
| Range | Between 0% and 100% | Beyond 100% (e.g., 127.2%, 161.8%, 261.8%) |
| Use Case | Entry zones for countertrend or trend continuation | Profit-taking and target projection |
| Application | Used during pullbacks | Used during trend continuations |
In essence, retracements look backward, while extensions look forward.
How to Trade Using Fibonacci Extensions
Traders typically use Fibonacci Extensions as part of a structured trading strategy rather than in isolation. Here’s a step-by-step guide:
1. Identify the Trend Direction
Confirm whether the asset is trending upward or downward. Use tools such as moving averages, trendlines, or market structure analysis.
2. Draw the Fibonacci Extension
- In an uptrend, draw from the swing low (Point 1) to the swing high (Point 2), then to the retracement low (Point 3).
- In a downtrend, draw from the swing high (Point 1) to the swing low (Point 2), then to the retracement high (Point 3).
3. Identify Potential Targets
Watch for price reactions at the 127.2%, 161.8%, or 261.8% levels. These can act as take-profit zones or potential reversal points.
4. Combine With Other Tools
Fibonacci Extensions are most effective when used alongside:
- Support and resistance zones
- Trendlines or channels
- Candlestick patterns (e.g., doji, engulfing patterns)
- Momentum indicators like RSI or MACD
5. Manage Risk
Never rely solely on Fibonacci levels. Use proper stop-loss orders, and ensure your risk-to-reward ratio aligns with your strategy (e.g., 1:2 or better).
Practical Example
Let’s consider a real-world scenario:
A trader observes that gold prices rallied from $1,900 to $2,000, then retraced to $1,950.
They apply the Fibonacci Extension tool to project possible continuation targets.
- 127.2% extension: Around $2,050
- 161.8% extension: Around $2,080
- 261.8% extension: Around $2,150
As prices move higher, the trader may take partial profits at $2,050 and let the remainder ride toward $2,080.
This systematic approach ensures discipline and structure in trade management.
Advantages of Using Fibonacci Extensions
- Clear Profit Targets
Helps traders establish realistic price objectives beyond previous highs or lows. - Objective Framework
Provides mathematically derived levels rather than emotional decision-making. - Universal Application
Works across all asset classes—forex, stocks, commodities, and crypto. - Compatibility With Other Indicators
Can be combined with trend analysis, moving averages, or chart patterns to improve reliability. - Scalable Across Timeframes
Useful for scalpers, swing traders, and long-term investors alike.
Limitations and Risks
Despite its popularity, Fibonacci Extensions have limitations:
- Subjectivity in Swing Points: Different traders may select different swing highs and lows, leading to varying results.
- Not Always Accurate: Markets don’t always respect Fibonacci levels; they may overshoot or fail to reach them.
- Dependence on Market Conditions: Works best in trending markets; less effective during sideways consolidation.
- False Signals: Can produce misleading targets if used in isolation.
To mitigate these drawbacks, traders often combine Fibonacci Extensions with volume analysis, price action, and trend confirmation tools.
Fibonacci Extensions in Different Market Contexts
Forex Market
Forex traders frequently use Fibonacci Extensions to set take-profit zones after retracements, especially in trending currency pairs like EUR/USD or GBP/JPY.
Stock Market
In equities, extensions help traders project price targets after breakout moves or earnings-driven rallies.
Cryptocurrency
Crypto traders often use Fibonacci levels to gauge the potential top or bottom of strong impulsive moves, given the market’s volatility.
Combining Fibonacci Extensions with Retracements
Advanced traders often overlay both retracement and extension tools.
This creates “confluence zones”—areas where two or more Fibonacci levels align.
When a retracement level from a larger move coincides with an extension level from a smaller move, the resulting area becomes a high-probability price zone.
These confluences are often used as strong decision points for entries or exits.
Conclusion
The Fibonacci Extension is a vital tool for modern technical analysts and traders. By projecting possible future price levels using mathematical ratios from the Fibonacci sequence, it provides structure and discipline to trading decisions.
While no tool guarantees accuracy, understanding Fibonacci Extensions can help traders:
- Identify logical profit targets
- Anticipate resistance or support zones
- Manage trades with greater confidence
When used together with sound risk management and complementary indicators, Fibonacci Extensions can significantly enhance a trader’s ability to navigate volatile markets with precision.
Trade on the Go. Anywhere, Anytime
If you’re ready to apply what you’ve learned, consider trading with a globally recognized forex and CFD broker like XM .
The platform offers competitive spreads, fast execution, and access to advanced trading tools, including real-time charts and flexible account types, making it suitable for both beginners and experienced traders. Open a trading account for free and start trading today and join millions of traders and investors on the global forex market.
Trading involves risk. Ensure you understand how the markets work before investing.