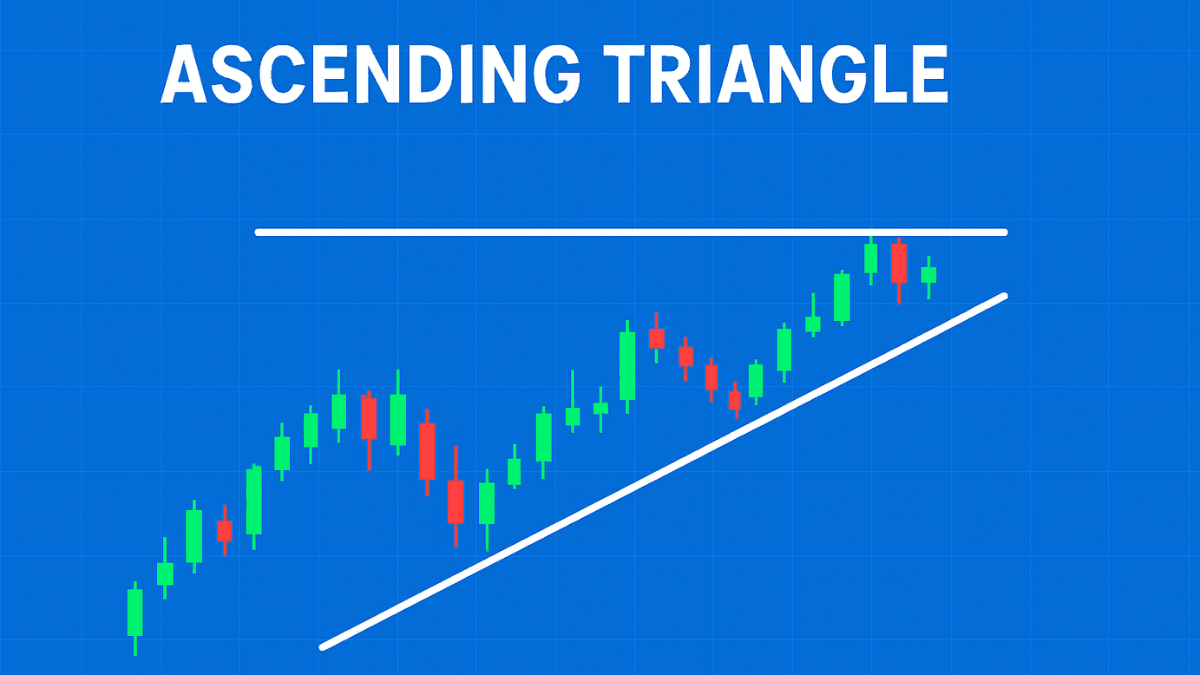
An ascending triangle is a bullish-leaning chart pattern in technical analysis, characterized by a horizontal resistance line at the top of the pattern and an upward-sloping trend line at the bottom that marks higher lows. Essentially, price repeatedly hits a resistance level while buyers step in earlier and earlier, driving the lows progressively higher.
Why It Matters
When price action forms an ascending triangle, it indicates that buyers are gradually gaining strength—making higher bids—while sellers continue to defend a specific resistance zone. This dynamic builds pressure and often leads to a breakout above the resistance level. In this way, the ascending triangle serves as a visual cue that a bullish continuation (or, at times, a reversal) may be imminent. The pattern gives traders:
- A recognizable structure (flat top + rising bottom)
- A potential breakout direction (typically up)
- A target projection (based on the height of the triangle)
- A clear level for stop-loss placement (just below the rising support line)
How It Works – Step by Step
- Trend context: Ideally, the pattern occurs within an existing uptrend. Buyers are already in control, and the ascending triangle is a consolidation phase.
- Formation of trend lines:
- The top horizontal line is drawn across at least two (often more) swing highs that lie at approximately the same price level (“resistance”).
- The bottom trend line is drawn through at least two (and preferably more) higher lows that steadily ascend.
- Consolidation phase: As the triangle develops, the price range narrows: highs remain capped by resistance, while lows rise. Volume often contracts during this phase as the “battle” between buyers and sellers quiets.
- Breakout: Eventually, buying pressure overcomes sellers, and the price breaks above the horizontal resistance line. Preferably, this occurs with a volume increase, confirming the breakout.
- Post-breakout behaviour: After the breakout, the old resistance line may act as a new support. Traders often measure the triangle’s height and project it upward from the breakout point to estimate a target price.
Examples and Scenarios
- Suppose a stock in an uptrend rallies to $50 several times but fails to break above it. Meanwhile, each pull-back makes a higher low: $45 → $47 → $49. The horizontal resistance is at $50, and the rising trend line connects the higher lows. This forms an ascending triangle. A breakout above $50 on strong volume might signal the next leg up.
- In another scenario, the pattern might appear after a downtrend. If a descending asset begins forming higher lows beneath a flat resistance line, it may serve as a reversal pattern rather than a continuation. While less common, an ascending triangle in a downtrend can signal a shift in momentum.
Key Components and Types
Components:
- Resistance line: A horizontal line linking (at least) two or more peaks of similar height.
- Ascending support line: A trend line that connects higher lows, sloping upward.
- Volume pattern: Typically, volume decreases during consolidation and expands on the breakout.
- Breakout point: The moment when the price closes firmly above resistance (for a bullish breakout) or below support (if reversal fails).
Classification:
- Continuation versus reversal: Generally, ascending triangles are continuation patterns (i.e., the prevailing trend resumes). But when they form in a downtrend, they may represent a reversal.
- Timeframe variation: The pattern can be observed in short-term (intraday) charts or long-term (weekly/monthly) charts. Longer durations tend to carry greater weight.
Advantages, Limitations & Risks
Advantages:
- Provides clear structure: resistance, rising support, breakout point.
- Gives a measurable target: by projecting the height of the triangle.
- Easier to recognise than some more complex patterns.
- Works across asset classes: stocks, forex, commodities, crypto.
Limitations and Risks:
- False breakouts (fakeouts): Price may break above resistance but then fall back below, trapping traders. Pattern recognition is not a guarantee.
- Volume confirmation needed: A breakout on weak volume is less reliable.
- Imperfect shape: Real patterns seldom mirror textbook diagrams. The resistance line may slope slightly upward; the support may be jagged.
- Time decay: The closer the price approaches the apex (point where support and resistance lines converge), the more likely the breakout—but waiting too long can reduce reward/risk.
- Reversal possibility: If used in isolation, you may miss when the breakout goes downward (especially in weaker trends).
Role in Trading and Investing
For traders and investors, the ascending triangle is a useful tool in the technical-analysis toolbox:
- Entry point: A breakout above the resistance line gives a signal to enter long (buy) positions. Conservative traders may wait for a retest of resistance-turned-support.
- Stop-loss placement: Often set just below the rising support line (or a swing low within the pattern) to limit downside risk if the breakout fails.
- Profit target: Measured by taking the vertical height of the triangle (from the lowest low to the horizontal resistance) and projecting that distance from the breakout point.
- Trend confirmation: Used in conjunction with trend analysis—if the broader trend is up, the ascending triangle carries a stronger bias for a breakout.
- Risk management: Because false breakouts happen, setting the proper risk/reward, using volume confirmation, and combining with other indicators (e.g., moving averages, RSI) is important.
- Across markets: Applicable in equities, forex, commodities, and even cryptocurrencies. Pattern logic remains consistent: rising lows, horizontal highs, consolidation, then breakout.
Practical Tips for Traders
- Ensure there is an existing uptrend (for the classic bullish version).
- Draw trend lines carefully: The horizontal line does not need to be perfectly flat, but highs must align reasonably well. The support line must show successively higher lows.
- Monitor volume: A genuine breakout ideally shows increased trading volume.
- Be patient: Wait for a clear breakout (close above resistance) before entering.
- Consider waiting for a retest: After the breakout, the price may retrace to the old resistance (now support), offering a second chance.
- Use a stop-loss: Place it below the pattern’s lower trend line or a recent swing low within the triangle.
- Set a realistic target: Use the height-projection method, but be flexible—price may exceed or fall short of the target.
- Avoid entering too late: If the price reaches the apex of the triangle (lines converge) without a breakout, the potential reward may be limited.
- Combine with other signals: Use trend indicators (e.g., 50-day/200-day moving averages), momentum indicators (e.g., RSI, MACD), and volume analysis to bolster confidence.
Conclusion
The ascending triangle is a widely recognised technical analysis pattern that signals potential bullish continuation (and occasionally reversal) of price trends.
It is defined by two key trend lines: a horizontal resistance line at the top and an upward-sloping support line beneath. The pattern reflects growing buying pressure as higher lows form, while sellers hold resistance.
Click Here To Join our Telegram Community
A breakout above that resistance, ideally backed by expanding volume, offers a signalling opportunity for traders and investors. While the pattern is powerful, it is not foolproof: false breakouts, imperfect shapes, and other market variables can undermine its reliability. Used judiciously with good risk management, volume confirmation, and alignment with broader market context, the ascending triangle can be a valuable part of a technical-analysis toolkit.
In essence: higher lows → flat resistance → build of buying pressure → breakout. Recognising that sequence may help you spot potential breakout opportunities in your trading or investing journey.
Trade on the Go. Anywhere, Anytime
If you’re ready to apply what you’ve learned, consider trading with a globally recognized forex and CFD broker like XM .
The platform offers competitive spreads, fast execution, and access to advanced trading tools, including real-time charts and flexible account types, making it suitable for both beginners and experienced traders. Open a trading account for free and start trading today and join millions of traders and investors on the global forex market.
Trading involves risk. Ensure you understand how the markets work before investing.