A Spinning Top Candlestick is a common chart pattern used in technical analysis to show indecision in the market. Because traders rely on candlestick patterns to understand price behavior, the Spinning Top Candlestick helps them see when neither buyers nor sellers have clear control. Understanding this candlestick gives you deeper insight into market psychology and potential trend pauses.
What Is a Spinning Top Candlestick?
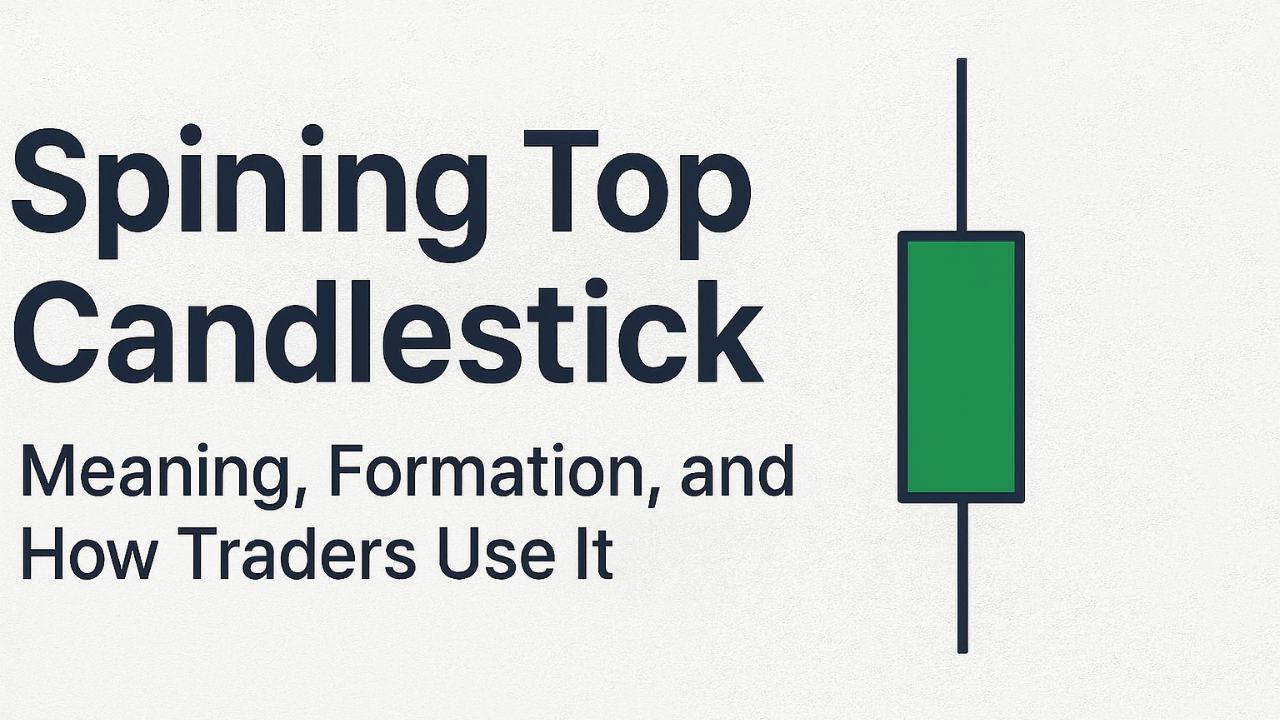
A Spinning Top Candlestick is a small-bodied candlestick with both upper and lower wicks (shadows) of nearly equal length. It shows that during the session, the price moved up and down, but ultimately closed close to its opening price.
This pattern signals uncertainty and often appears during strong uptrends or downtrends, hinting that momentum may be weakening.
How the Spinning Top Candlestick Forms
A Sinning Top forms when:
- Buyers push the price higher.
- Sellers push the price lower.
- Neither side is strong enough to dominate.
- The price closes near the opening level.
This creates:
- A small real body
- A long upper shadow
- A long lower shadow
The result is a balanced, almost symmetrical candle showing a tug-of-war between bulls and bears.
What a Spinning Top Candlestick Tells Traders
1. Market Indecision
The Spinning Top clearly shows that neither buyers nor sellers have strong control. Market participants are uncertain about the next price direction.
2. A Possible Pause in Trend
When this candlestick appears during a strong trend, it can signal a pause in momentum. The trend might continue, but the market is taking a “breather.”
3. A Potential Reversal—But Not Always
Many traders mistakenly assume a Spinning Top always means reversal. It does not. It only means indecision.
A reversal is possible only when supported by:
- Volume changes
- Following candlestick patterns
- Key support or resistance levels
Spinning Top vs. Doji: What’s the Difference?
While both patterns signal indecision, they are not the same.
Spinning Top
- Small real body
- Both wicks are long
- Shows volatility and indecision
Doji
- Almost no real body at all
- Wicks may or may not be long
- Shows extreme indecision and balance
The Spinning Top indicates more price movement than a Doji, which can make it more useful in volatile markets.
How Traders Use the Spinning Top Candlestick
1. Identifying Weakening Momentum
If a strong trend shows a Spinning Top, it may indicate the trend is slowing. Traders use this to tighten stop-losses or prepare for potential reversals.
2. Waiting for Confirmation
A single candlestick is never enough. Traders often wait for the next candle to confirm direction:
- A bullish candle afterward suggests buyers are regaining control.
- A bearish candle afterward suggests sellers are stepping in.
3. Using It With Support and Resistance
When a Spinning Top forms near key levels:
- At resistance, it may signal potential reversal downward.
- At support, it may signal potential bounce upward.
4. Combining It With Indicators
Many traders pair the Sinning Top with:
- Relative Strength Index (RSI)
- Moving Averages
- MACD
This helps them filter out false signals.
Examples of Market Situations Where Spinning Top Appears
During Uptrends
A Spinning Top may show that buyers are losing strength. Traders may watch for a shift toward selling pressure.
During Downtrends
A Spinning Top can indicate sellers are exhausting. A bullish reversal may follow if volume increases.
During Consolidation
It may appear repeatedly, confirming that the market has no clear direction.
Is the Spinning Top a Strong Pattern?
On its own, the Spinning Top is a neutral candlestick. It does not strongly signal a trend reversal or continuation.
Its true strength comes from:
- Where it appears
- What pattern forms after it
- Market context
When combined with technical tools, it becomes a helpful part of a larger trading strategy.
Common Mistakes Traders Make With the Sinning Top
- Assuming it means reversal automatically.
Many reversals require more than one candle for confirmation. - Ignoring trend strength.
In strong trends, a Sinning Top may simply be a pause. - Using it without support/resistance analysis.
Candlesticks are most reliable near key price levels. - Relying on one timeframe.
Multiple timeframes often reveal a clearer picture.
Why the Spinning Top Matters in Technical Analysis
The Spinning Top candlestick matters because it provides insight into market psychology. It helps traders understand that the market is struggling to choose a direction. While the candle itself is neutral, it offers valuable clues when placed within a larger analysis.
Final Thoughts
The Spinning Top Candlestick is a helpful pattern for identifying indecision in the market. Although it doesn’t predict exact reversals or continuations, its true value appears when traders combine it with other technical tools and price action analysis. Understanding this pattern strengthens your ability to read market sentiment and anticipate possible shifts in momentum.
FAQs About Spinning Top Candlestick
1. What does the Spinning Top Candlestick indicate?
It shows indecision in the market, meaning neither buyers nor sellers have strong control.
2. Is the Spinning Top a reversal pattern?
Not directly. It only signals uncertainty. A reversal requires confirmation.
3. Where is the Spinning Top most effective?
When it forms near support, resistance, or during the late stages of strong trends.
4. How is it different from a Doji?
A Spinning Top has a small body with long wicks, while a Doji has almost no body at all.
5. Should traders rely on it alone?
No. It works best when combined with indicators and larger market context.
Trade on the Go. Anywhere, Anytime
If you’re ready to apply what you’ve learned, consider trading with a globally recognized forex and CFD broker like XM .
The platform offers competitive spreads, fast execution, and access to advanced trading tools, including real-time charts and flexible account types, making it suitable for both beginners and experienced traders. Open a trading account for free and start trading today and join millions of traders and investors on the global forex market.
Trading involves risk. Ensure you understand how the markets work before investing.