The hammer candlestick is one of the most popular reversal signals in trading. Traders use it to spot potential market bottoms and time better entry points. Understanding this pattern gives you more confidence, especially when the market is volatile or moving quickly.
What Is a Hammer Candlestick?
A hammer candlestick is a bullish reversal pattern that appears after a price decline. It suggests that although sellers pushed the price down during the session, buyers regained control and drove the price back up before closing.
This shift shows that selling pressure may be weakening, and the market could be preparing to move upward.
Click Here To Join our Telegram Community
How a Hammer Candlestick Forms
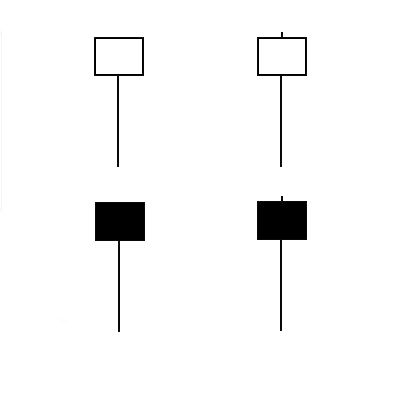
A hammer forms when the candlestick shows:
- A small real body near the top
- A long lower shadow at least 2–3 times the size of the body
- Little or no upper shadow
This shape looks like a hammer, which is where it gets its name.
What the Formation Tells You
- Sellers initially push the price lower.
- Buyers step in strongly and absorb the selling.
- Buyers gain enough strength to push prices near or above the opening level.
- Momentum shifts from bearish to bullish.
Key Characteristics of a Hammer
A hammer candlestick is a bullish signal when it appears after a downtrend. For a candlestick to qualify as a true hammer, it should meet these conditions:
- It has a very small upper shadow or none at all.
- The lower shadow is long, usually at least twice the size of the body.
- It must form after a clear downtrend, not in the middle of a sideways market.
- The body sits near the top of the candle’s overall range.
- The color of the body doesn’t matter, although a bullish (white/green) body strengthens the signal.
- The pattern works best when the next candle closes above the hammer’s high, showing confirmation from buyers.
- Do not confuse the hammer with a hanging man. They look the same, but the hanging man appears at the end of an uptrend, while the hammer forms at the bottom of a downtrend.
Where the Hammer Candlestick Appears Matters
A hammer has the strongest meaning when it appears:
1. After a Downtrend
It signals a possible reversal because buyers are showing interest at lower prices.
2. At a Key Support Level
Support zones make the pattern more reliable because buyers often defend these areas.
3. During Oversold Market Conditions
When indicators like RSI or Stochastic show oversold levels, the hammer’s reversal message becomes more convincing.
Hammer vs. Inverted Hammer
Although they sound similar, the two patterns are different:
Hammer
- Long lower shadow
- Appears after a downtrend
- Bullish reversal
Inverted Hammer
- Long upper shadow
- Appears after a downtrend
- Also bullish but weaker than a classic hammer
The normal hammer is generally considered more dependable.
Why Traders Trust the Hammer Candlestick
The hammer pattern shows a strong rejection of lower prices, which often marks a turning point.
Here’s why traders value it:
- It’s easy to identify.
- It works well with support and resistance.
- It provides early entry signals in trend reversals.
- It reflects real market psychology—buyers overpowering sellers.
How to Trade the Hammer Candlestick
While the hammer is powerful, traders rarely use it alone. Here is a simple, practical approach:
1. Confirm the Trend
Make sure a downtrend exists. A hammer is not useful in sideways or unclear markets.
2. Wait for Confirmation Candle
A bullish candle closing above the hammer’s high strengthens the reversal signal.
3. Use Reliable Support Levels
If the hammer appears at a strong support zone, the probability of reversal increases.
4. Set Logical Stop-Loss
Traders commonly place stop-losses below the hammer’s lower shadow to protect against false signals.
5. Combine with Indicators
Confirmation tools include:
- RSI (oversold zone)
- Moving averages
- MACD crossovers
- Volume increase on the reversal candle
Using several signals together improves accuracy.
Common Mistakes Traders Make With the Hammer Pattern
Even though the hammer seems simple, beginners often misuse it. Here are common mistakes to avoid:
Mistake 1: Ignoring the Trend Context
A hammer in an uptrend is not meaningful.
Mistake 2: Trading Without Confirmation
Jumping in immediately can lead to false signals.
Mistake 3: Treating Every Long Wick as a Hammer
The structure must match the definition—small body, long lower shadow, and almost no upper shadow.
Mistake 4: Not Using Risk Management
Every candlestick pattern, even strong ones, can fail in fast markets.
How Reliable Is the Hammer Candlestick?
The hammer is reliable when:
- The market has been falling
- It forms at major support
- Volume rises on the bounce
- A confirmation candle appears
It becomes less reliable when:
- It forms in a sideways market
- There is no confirmation
- It appears at random price levels
Like all technical patterns, it provides a probability—not a guarantee.
Hammer in Forex, Stocks, Crypto, and Commodities
The hammer works across different markets because it reflects universal trading psychology—fear, pressure, and buyer strength.
Forex
Often used on major pairs like EUR/USD or GBP/USD where price swings are common.
Stocks
Helps identify potential bottoming areas after sell-offs.
Crypto
Useful but should be combined with volume due to high volatility.
Commodities
Works well on gold, oil, and metals, especially around major support zones.
Example of a Strong Hammer Candlestick
Imagine a market falling for several days. Today’s price opens at $50, drops sharply to $44, then buyers rush in. By the end of the session, price closes at $49.50.
This creates:
- A tiny body near the top
- A long lower wick
- A signal that buyers pushed back strongly
This shows that selling pressure is losing strength, and the market may reverse upward.
Should You Rely on the Hammer Alone?
No. The hammer is powerful, but confirmation and context matter. You improve results by combining it with:
- Trend analysis
- Support and resistance
- Indicators
- Volume action
Smart traders use the hammer as a signal, not a full trading strategy.
Final Thoughts
The hammer candlestick is one of the simplest but most meaningful reversal patterns in trading. It tells a clear story: sellers tried to push prices lower, but buyers fought back and won. When it forms after a downtrend—especially around support—it becomes a valuable tool for identifying potential bullish reversals.
Use it with confirmation and risk management, and it becomes a dependable addition to your trading strategy.
Trade on the Go. Anywhere, Anytime
If you’re ready to apply what you’ve learned, consider trading with a globally recognized forex and CFD broker like XM .
The platform offers competitive spreads, fast execution, and access to advanced trading tools, including real-time charts and flexible account types, making it suitable for both beginners and experienced traders. Open a trading account for free and start trading today and join millions of traders and investors on the global forex market.
Trading involves risk. Ensure you understand how the markets work before investing.