A broadening formation is a technical chart pattern that shows expanding price swings and rising market volatility. Traders often study this pattern to understand shifts in market sentiment and to identify potential breakout zones. Because it forms during periods of uncertainty, it attracts attention in both short-term and long-term market analysis.
Before exploring the structure and variations of this pattern, it helps to understand why it forms and what it signals about market psychology.
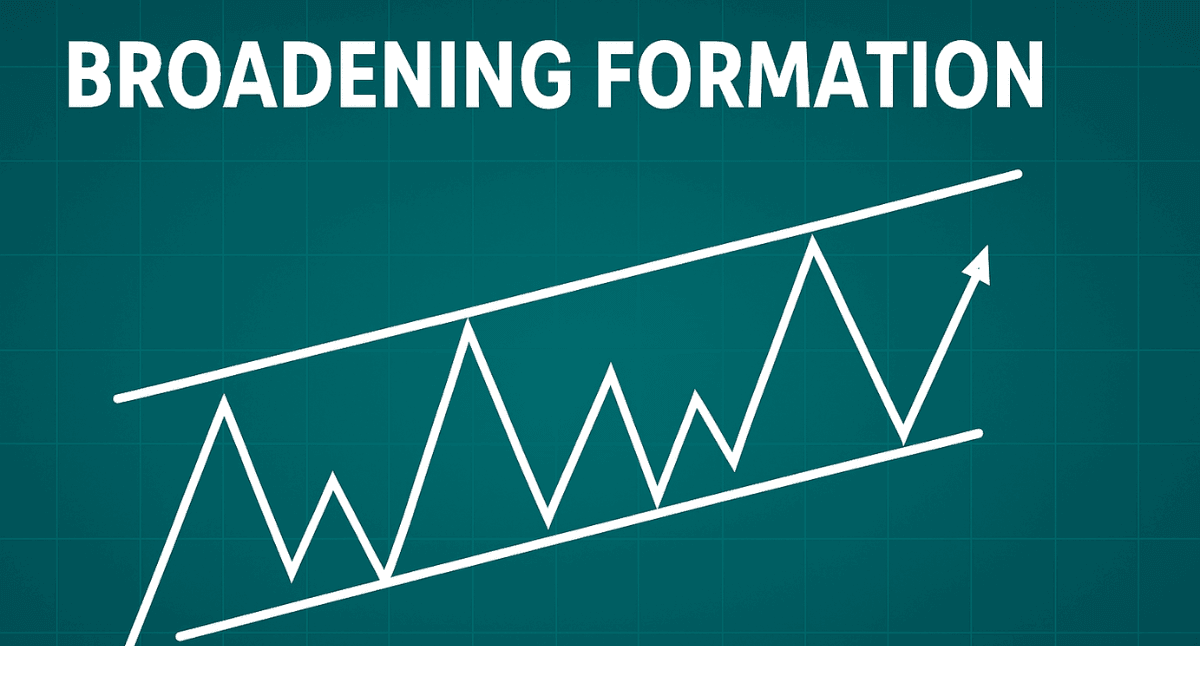
What Is a Broadening Formation?
A broadening formation is a chart pattern where price moves outward, creating higher highs and lower lows over time. The pattern expands like a megaphone, showing that buyers and sellers are becoming more aggressive. This increasing volatility can appear in stocks, forex, commodities, and even crypto markets.
This structure often appears during emotional markets where participants are unsure about future direction. It is not always a trend-continuation signal, as it may lead to a breakout, either upward or downward,,, depending on which side prevails.
Why a Broadening Formation Occurs
Before breaking down the structure, it is useful to understand the psychology behind this pattern. Markets do not expand randomly. Instead, widening movement often points to disagreement among traders about fair value.
Market Psychology Behind the Pattern
The pattern forms because price swings grow larger with every move. Each bullish push makes a new high, and each bearish move digs deeper. This tug-of-war shows a lack of consensus and signals that the market is preparing for a major move.
When the market stretches repeatedly in opposite directions, it warns traders that strong volatility may continue until one side finally wins the battle.
Structure of a Broadening Formation
To understand the pattern clearly, we need to examine how it looks on a chart. A broadening formation contains two diverging trendlines: one ascending and one descending.
Key Structural Features
- The upper trendline slopes upward, connecting at least two or three higher highs.
- The lower trendline slopes downward, linking two or more lower lows.
- Price swings widen over time, giving the pattern a megaphone-like appearance.
- Volatility expands instead of contracting, unlike symmetrical triangles.
Each swing becomes stronger than the previous one, which helps traders identify when the market is overheating in either direction.
Types of Broadening Formations
There are several variations of this pattern. Understanding their differences helps traders identify which version they are seeing and what it may signal.
1. Broadening Top
A broadening top forms after an uptrend when buyers lose control. The pattern still shows higher highs, but the deeper lows signal growing weakness. Many traders consider this a potential reversal signal, especially if volume increases on bearish swings.
2. Broadening Bottom
A broadening bottom often appears after a downtrend. Sellers continue to push prices lower, but buyers respond with stronger rallies. As the swings widen, the pattern may prepare for a bullish breakout. This can act as a reversal structure when supported by rising volume.
3. Horizontal Broadening Formation
Sometimes the upper trendline and lower trendline do not slope significantly. In this version, the highs and lows expand sideways instead of diagonally. Traders use this structure to anticipate strong breakouts in either direction.
With all types, mood shifts in the market gradually reveal which side is gaining strength.
How Traders Interpret a Broadening Formation
Now that the different types are clear, the next step is understanding how traders use the pattern for decision-making. The broadening formation is not easy to trade because of its volatility, but it provides useful signals.
Key Interpretations
- It often indicates market indecision but with increasing aggression.
- The pattern warns of a strong potential breakout.
- Direction becomes clearer once price breaks and closes outside the structure.
- Volume expansion increases the reliability of the breakout.
While the pattern gives early warnings, confirmation is always required to reduce unnecessary risk.
Using the Broadening Formation in Trading
Before considering entry or exit points, traders need to understand the practical use of this pattern. It is a high-volatility structure, so risk control remains essential.
Entry and Exit Considerations
Traders usually wait for:
- A confirmed breakout above the upper trendline for bullish scenarios
- A confirmed breakdown below the lower trendline for bearish scenarios
A breakout becomes more trustworthy when:
- The candle closes clearly beyond the trendline
- Momentum indicators support the move
- Volume rises in the direction of the breakout
Once the breakout is confirmed, traders often aim for targets using the height of the widest swing within the formation.
Common Mistakes Traders Make
Before concluding, it helps to understand the errors traders often commit when reading this pattern. This reduces the chance of being misled by false signals.
Frequent Mistakes
- Entering trades before a confirmed breakout
- Ignoring volume during key expansions
- Assuming the pattern always leads to reversal
- Overlooking broader market condit,ions such as news and economic events
Recognizing these mistakes helps traders use the broadening formation more effectively and avoid unnecessary risk.
Final Thoughts
A broadening formation is a powerful chart pattern that signals expanding volatility and emotional trading conditions. It reflects a market where buyers and sellers disagree strongly about price direction. By understanding its structure, types, and trading implications, you gain a clearer view of potential breakouts and key turning points.
Although the pattern can be challenging, proper confirmation and risk management make it a useful tool for traders seeking to understand market behavior.
Trade on the Go. Anywhere, Anytime
If you’re ready to apply what you’ve learned, consider trading with a globally recognized forex and CFD broker like XM .
The platform offers competitive spreads, fast execution, and access to advanced trading tools, including real-time charts and flexible account types, making it suitable for both beginners and experienced traders. Open a trading account for free and start trading today and join millions of traders and investors on the global forex market.
Trading involves risk. Ensure you understand how the markets work before investing.