The Bear Flag is one of the most reliable continuation patterns used in technical analysis. Traders across forex, stocks, crypto, and commodities rely on it to identify moments when a strong downtrend is likely to resume after a short pause.
Understanding how the Bear Flag works can help traders avoid false reversals, improve entry timing, and manage risk more confidently. This guide explains the Bear Flag pattern clearly, step by step, using simple language while maintaining professional accuracy.
Click here to connect with us on Telegram
What Is a Bear Flag Pattern?
Before looking at how to trade it, it is important to understand what the Bear Flag really represents in the market.
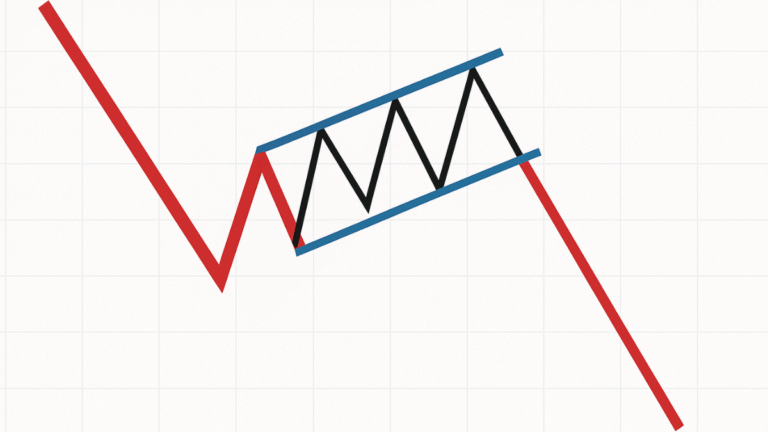
A Bear Flag is a bearish continuation chart pattern that forms after a sharp price drop. The price then moves sideways or slightly upward in a tight range, creating a short consolidation phase before continuing lower.
This pattern reflects a temporary pause where sellers take a break, not a full trend reversal. Once selling pressure returns, the price usually breaks down and continues in the direction of the original downtrend.
Why the Bear Flag Matters in Trading
The Bear Flag is popular because it reflects real market behavior, not just technical theory.
Strong trends rarely move in a straight line. Instead, they pause, consolidate, and then continue. The Bear Flag helps traders recognize these pauses and prepare for the next move down instead of exiting too early or entering too late.
When used correctly, it can improve trade timing and reduce emotional decision-making.
Key Components of a Bear Flag Pattern
To identify a Bear Flag correctly, you need to understand its structure. Each part of the pattern plays a specific role.
The Flagpole
The pattern begins with a sharp and aggressive price drop known as the flagpole.
This move shows strong bearish momentum, often driven by news, earnings, or a shift in market sentiment. High volume usually supports this phase, confirming strong selling pressure.
The Flag (Consolidation Phase)
After the sharp drop, the price moves sideways or slightly upward in a narrow channel. This forms the flag.
This consolidation happens because some traders take profits while others wait for confirmation. Importantly, the price does not make a strong recovery, which shows that buyers lack real strength.
The Breakdown
The final part of the Bear Flag occurs when the price breaks below the lower boundary of the flag.
This breakdown signals that sellers are back in control. Many traders enter short positions at this point, expecting the downtrend to continue.
How to Identify a Bear Flag on a Chart
Recognizing a Bear Flag requires patience and attention to detail.
First, look for a strong downward move with clear momentum. Then wait for a small upward or sideways correction that forms a tight channel. Finally, watch for a clean breakdown below support.
The pattern works best when the consolidation is short and orderly, not wide or chaotic.
How to Trade the Bear Flag Pattern
Trading a Bear Flag effectively requires a clear plan. Random entries often lead to losses, even when the pattern looks correct.
Entry Strategy
Most traders enter a Bear Flag trade when the price breaks below the lower trendline of the flag.
This confirms that the consolidation has ended and bearish momentum is returning. Waiting for a confirmed breakdown helps avoid false signals.
Stop-Loss Placement
Risk management is essential when trading Bear Flags.
A common approach is to place the stop-loss slightly above the upper boundary of the flag. This protects the trade if the pattern fails and price breaks upward instead.
Take-Profit Targets
Profit targets are often based on the length of the flagpole.
Many traders measure the initial drop and project that distance downward from the breakout point. This method provides a logical and objective target rather than guessing.
Common Mistakes Traders Make with Bear Flags
Even reliable patterns can fail when misunderstood or traded incorrectly.
Some common mistakes include:
- Entering too early before a confirmed breakdown
- Ignoring the overall market trend
- Trading Bear Flags during low-volume or choppy conditions
Avoiding these errors improves consistency and protects trading capital.
Key Differences of Bear Flag and Bull Flag
Understanding the Bear Flag is easier when compared to its bullish counterpart.
While a Bear Flag forms after a sharp decline and continues downward, a Bull Flag forms after a strong upward move and continues higher. The structure is similar, but the market direction is opposite.
This comparison helps traders stay aligned with trend direction rather than fighting it.
Best Markets and Timeframes for Bear Flags
The Bear Flag pattern works across many markets.
It is commonly used in:
- Forex pairs during strong trends
- Stocks after earnings or news events
- Cryptocurrencies during high-volatility phases
The pattern can appear on any timeframe, but it tends to be more reliable on higher timeframes where market noise is lower.
Can the Bear Flag Pattern Fail?
No pattern works all the time, and the Bear Flag is no exception.
False breakouts can occur, especially in weak trends or during low-liquidity periods. This is why confirmation, volume analysis, and proper risk management are essential.
Successful traders focus on probability, not certainty.
Final Thoughts
The Bear Flag is a simple yet powerful pattern that helps traders follow strong downtrends with more confidence. It reflects natural market pauses rather than emotional reversals, making it especially useful for trend-based strategies.
When combined with proper risk management, market context, and patience, the Bear Flag can become a valuable tool in any trader’s technical analysis toolkit.