A Diamond Top Formation is a technical analysis pattern that signals a possible bearish reversal after an uptrend. Traders watch this pattern closely because it often appears before a market loses momentum and begins to fall. Understanding this formation helps investors identify early warning signs of trend changes and manage risk more effectively.
What Is a Diamond Top Formation?
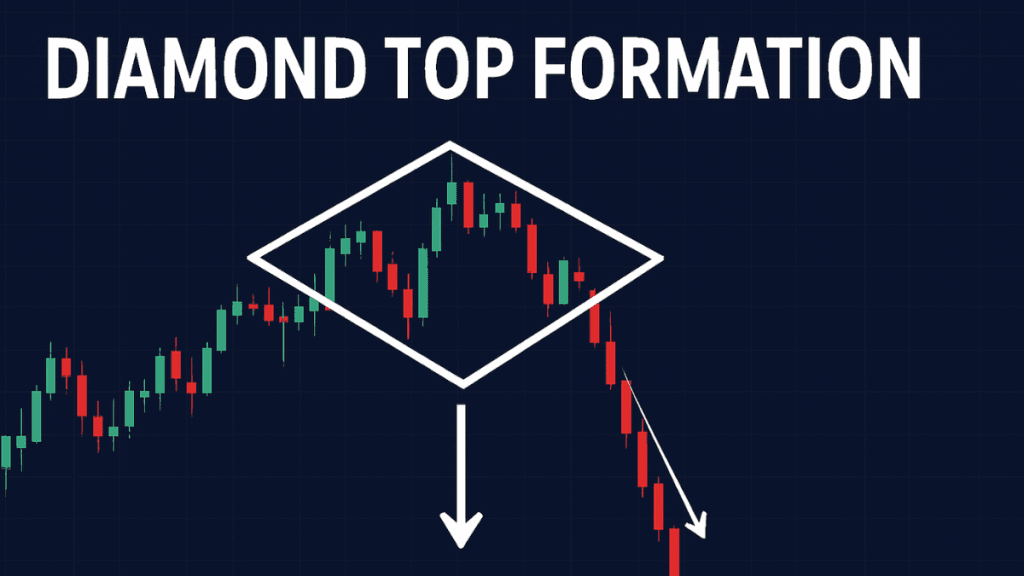
A Diamond Top Formation is a chart pattern that resembles the shape of a diamond when outlined on a price chart. It forms at the top of an uptrend and typically marks the market’s shift from rising prices to a new downward movement.
The pattern combines widening price swings at the beginning and narrowing swings toward the end. This shift reflects increasing instability followed by tightening price action before the breakout.
How the Diamond Top Formation Develops
The formation usually happens in two stages:
1. Broadening Phase
In the early stage, price swings become wider. Highs get higher, and lows get lower, creating a broad, expanding structure.
This shows:
- Market volatility is rising
- Buyers and sellers are battling for control
- The uptrend is becoming unstable
2. Contracting Phase
After volatility peaks, price movement becomes tighter.
Here, the market forms:
- Lower highs
- Higher lows
This narrowing range creates the second half of the diamond shape.
When price finally breaks below the lower support line, traders take it as a bearish signal.
Why the Diamond Top Formation Matters
This pattern is important because it warns traders that the uptrend may be ending. It often develops after strong bullish momentum, making the reversal more significant.
A confirmed Diamond Top can indicate:
- Trend exhaustion
- Reduced buying pressure
- A shift toward selling dominance
- The beginning of a potential downtrend
Because of these signals, many traders use the pattern to protect profits or prepare for short-selling opportunities.
How Traders Confirm a Diamond Top Breakout
A Diamond Top is not considered complete until the price breaks below the support line on the right side of the pattern.
Traders also look for:
- Strong volume during the breakdown
- A clean close below support
- Retest of the broken area (optional but common)
Once confirmed, the breakout often leads to downward price movement.
How to Trade the Diamond Top Formation
Although trading styles differ, most traders follow similar steps:
1. Identify the Diamond Shape
Confirm both the expanding and contracting phases. Without the full structure, the pattern may be invalid.
2. Wait for a Breakout
Only act when price clearly breaks down through support. Acting early increases the chance of false signals.
3. Set Profit Targets
Many traders measure the height of the diamond and project that distance downward from the breakout point.
4. Manage Risk
A stop-loss order is usually placed above the last lower high inside the pattern or slightly above the breakout zone.
Common Mistakes Traders Make
While the Diamond Top is powerful, it can be misused. Common mistakes include:
- Entering too early before the breakout
- Assuming every diamond-like shape is valid
- Ignoring volume confirmation
- Using the pattern without checking the broader trend
Patience is essential. The best signals come from a fully formed and well-defined diamond.
Difference Between a Diamond Top and Other Patterns
The Diamond Top is unique because it includes both broadening and contracting movements. It often gets confused with other reversal patterns, but it stands apart in structure.
Diamond Top vs. Head and Shoulders
- Diamond has a wider shape and more volatility
- Head and Shoulders has clearer peaks and valleys
Diamond Top vs. Double Top
- Double Top has two peaks
- Diamond Top has multiple highs and lows forming a diamond shape
Understanding these differences helps traders avoid misinterpreting the market.
When the Diamond Top Formation Works Best
The pattern is more reliable when:
- It forms after a strong, extended uptrend
- Volume increases during the breakdown
- Other indicators confirm weakening momentum
Traders often combine it with:
- RSI divergence
- Moving averages
- Support and resistance zones
- Volume analysis
Using multiple tools improves accuracy and reduces risk.
FAQs About the Diamond Top Formation
1. What is a Diamond Top Formation?
A Diamond Top Formation is a bearish reversal chart pattern that appears after an uptrend. It forms a diamond-like shape and signals that the price may soon drop.
2. Is the Diamond Top Formation reliable?
Yes, it is considered a reliable reversal signal, especially when confirmed by strong volume during the breakdown and additional indicators such as RSI or moving averages.
3. How do I confirm a Diamond Top breakout?
A breakout is confirmed when the price closes below the lower support line on the right side of the pattern. High volume during this move adds further confirmation.
4. How long does a Diamond Top Formation take to form?
It can take anywhere from a few days to several weeks, depending on market conditions and the timeframe. Longer formations often create stronger signals.
5. What is the difference between a Diamond Top and Head and Shoulders?
A Diamond Top includes both expanding and contracting price swings, forming a diamond shape. The Head and Shoulders pattern has a clear left shoulder, head, and right shoulder structure.
6. Can I use the Diamond Top pattern alone to trade?
It’s not recommended. While powerful, it should be combined with other tools such as volume analysis, trendlines, or momentum indicators for safer and more accurate decisions.
Final Thoughts
The Diamond Top Formation is a valuable bearish reversal pattern that helps traders spot potential market turning points. Its distinct shape — created by widening and then narrowing price ranges — signals a shift in market psychology and possible trend exhaustion.
When confirmed with a clear breakdown and supported by other indicators, this pattern can provide timely entry and exit signals, helping traders protect profits and make informed decisions.
Understanding how this formation works strengthens your technical analysis skills and prepares you for more confident trading in volatile markets.