The Fibonacci Fan is a technical analysis tool used by traders to identify potential support and resistance levels in trending markets. It is based on Fibonacci ratios and helps traders understand how the price may react as it moves over time. When used correctly, it can improve timing, trend analysis, and risk management in trading.
To understand how the Fibonacci Fan works and why traders trust it, it is important to first explore its foundation and purpose in technical analysis.
Click here to connect with us on Telegram
What Is a Fibonacci Fan?
The Fibonacci Fan is a charting indicator that draws diagonal lines from a significant high or low on a price chart. These lines are based on key Fibonacci ratios and extend forward to show potential areas where price may slow down, reverse, or continue its trend.
Before using the Fibonacci Fan effectively, traders must understand that it is not a prediction tool. Instead, it offers probability-based guidance, helping traders analyze price behavior within an existing trend.
The Origin of the Fibonacci Fan
The Fibonacci Fan is derived from the Fibonacci sequence, a mathematical series where each number is the sum of the two preceding ones. In trading, specific ratios from this sequence appear frequently in market movements.
These ratios are widely accepted because financial markets often move in waves influenced by human behavior, psychology, and natural proportions. As a result, Fibonacci-based tools have become standard in technical analysis.
Key Fibonacci Ratios Used in Fibonacci Fan
Before applying the Fibonacci Fan, traders should understand the ratios that form its structure. These ratios determine the slope and spacing of the fan lines.
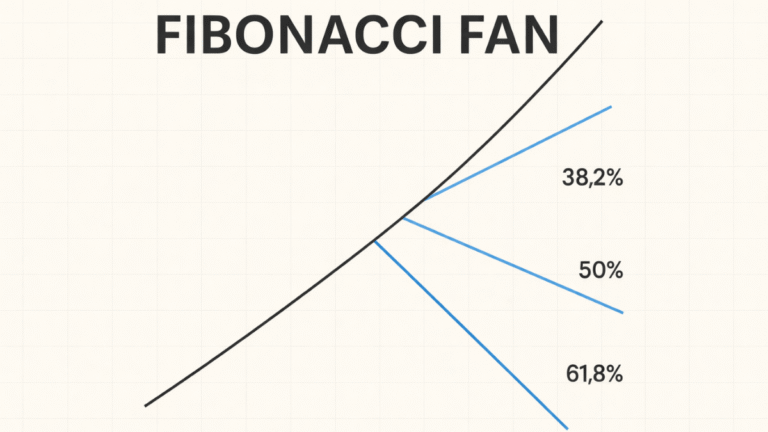
Common Fibonacci Fan ratios include:
- 38.2%
- 50%
- 61.8%
Each ratio represents a potential dynamic support or resistance level. The 61.8% ratio, often called the “golden ratio,” is considered the most influential among them.
How the Fibonacci Fan Works
To apply the Fibonacci Fan, a trader selects two key points on a chart: a major swing low and a major swing high. From the starting point, diagonal lines are drawn through Fibonacci ratio levels projected forward in time.
As price moves, it often reacts to these fan lines by bouncing, consolidating, or reversing. This behavior makes the Fibonacci Fan especially useful in trending markets.
How to Draw a Fibonacci Fan Correctly
Drawing the Fibonacci Fan correctly is critical for accurate analysis. Errors in point selection can reduce its effectiveness.
Step-by-Step Process
To ensure precision, follow these steps carefully:
- Identify a clear trend (uptrend or downtrend).
- Select a significant swing low and swing high.
- Apply the Fibonacci Fan tool from the start of the trend to the end.
- Allow the fan lines to extend forward automatically.
Once applied, traders should observe how price interacts with each diagonal line rather than reacting to every slight movement.
Fibonacci Fan in an Uptrend
In an uptrend, the Fibonacci Fan is drawn from the swing low to the swing high. The fan lines then act as dynamic support levels.
When price pulls back during an uptrend, it often finds support near one of the fan lines before continuing higher. This makes the Fibonacci Fan useful for identifying potential buying zones.
Fibonacci Fan in a Downtrend
In a downtrend, the Fibonacci Fan is drawn from the swing high to the swing low. In this case, the fan lines act as dynamic resistance levels.
As price retraces upward, it may stall or reverse near a fan line. Traders often use these areas to look for selling opportunities or trend continuation signals.
Why Traders Use Fibonacci Fan
Many traders rely on the Fibonacci Fan because it combines price, time, and trend direction into one tool. Unlike horizontal Fibonacci retracement levels, the fan adjusts dynamically as time progresses.
Key benefits include:
- Identifying trend-based support and resistance
- Improving trade timing
- Enhancing risk-to-reward decisions
- Supporting trend continuation strategies
Because of these advantages, the Fibonacci Fan is widely used in forex, stocks, indices, and cryptocurrencies.
Fibonacci Fan vs Fibonacci Retracement
Although both tools use Fibonacci ratios, they serve different purposes. Understanding the difference helps traders choose the right tool.
Fibonacci retracement focuses on horizontal price levels, while the Fibonacci Fan focuses on diagonal trend-based levels. This makes the Fibonacci Fan more suitable for trending markets where time plays a key role.
Best Timeframes to Use Fibonacci Fan
The Fibonacci Fan works best on higher timeframes where trends are clearer and market noise is reduced. Daily, weekly, and four-hour charts tend to provide more reliable results.
Lower timeframes can still be used, but traders should combine the Fibonacci Fan with additional confirmation tools to avoid false signals.
Combining Fibonacci Fan With Other Indicators
The Fibonacci Fan becomes more powerful when used alongside other technical indicators. This approach improves accuracy and reduces emotional decision-making.
Common combinations include:
- Trendlines for confirmation
- Moving averages for trend strength
- RSI for momentum analysis
- Candlestick patterns for entry timing
Using confluence between tools increases the probability of successful trades.
Common Mistakes When Using the Fibonacci Fan
Despite its usefulness, the Fibonacci Fan can be misused if traders lack discipline or understanding.
Some common mistakes include:
- Drawing the fan on unclear trends
- Using it as a standalone signal
- Ignoring market structure
- Over-adjusting swing points
Avoiding these errors helps maintain consistency and reliability in analysis.
Is Fibonacci Fan Reliable?
The Fibonacci Fan is reliable when used correctly and in the right market conditions. Like all technical tools, it does not guarantee success but improves decision-making by highlighting high-probability areas.
Professional traders treat it as a guide, not a rule. Risk management and confirmation remain essential.
Who Should Use a Fibonacci Fan?
The Fibonacci Fan is suitable for both beginners and experienced traders. Beginners benefit from its visual clarity, while advanced traders appreciate its ability to integrate time and trend analysis.
Investors can also use it for long-term trend assessment, especially in strongly trending markets.
Final Thoughts
The Fibonacci Fan is a powerful yet simple technical analysis tool that helps traders understand price behavior within a trend. By combining Fibonacci ratios with time-based projections, it offers valuable insight into dynamic support and resistance levels.
When applied with patience, discipline, and proper confirmation, the Fibonacci Fan can significantly improve trading confidence and consistency. As with any tool, mastery comes through practice, observation, and continuous learning.