The LIBOR Curve refers to the graphical representation of interest rates based on the London Interbank Offered Rate (LIBOR) across different maturities. It shows how borrowing costs change over time, typically ranging from overnight rates to 12 months.
In simple terms, the LIBOR Curve helps financial professionals understand the cost of borrowing between banks over various time periods. It acts as a reference point for pricing loans, derivatives, and other financial products tied to short-term interest rates.
How the LIBOR Curve Works
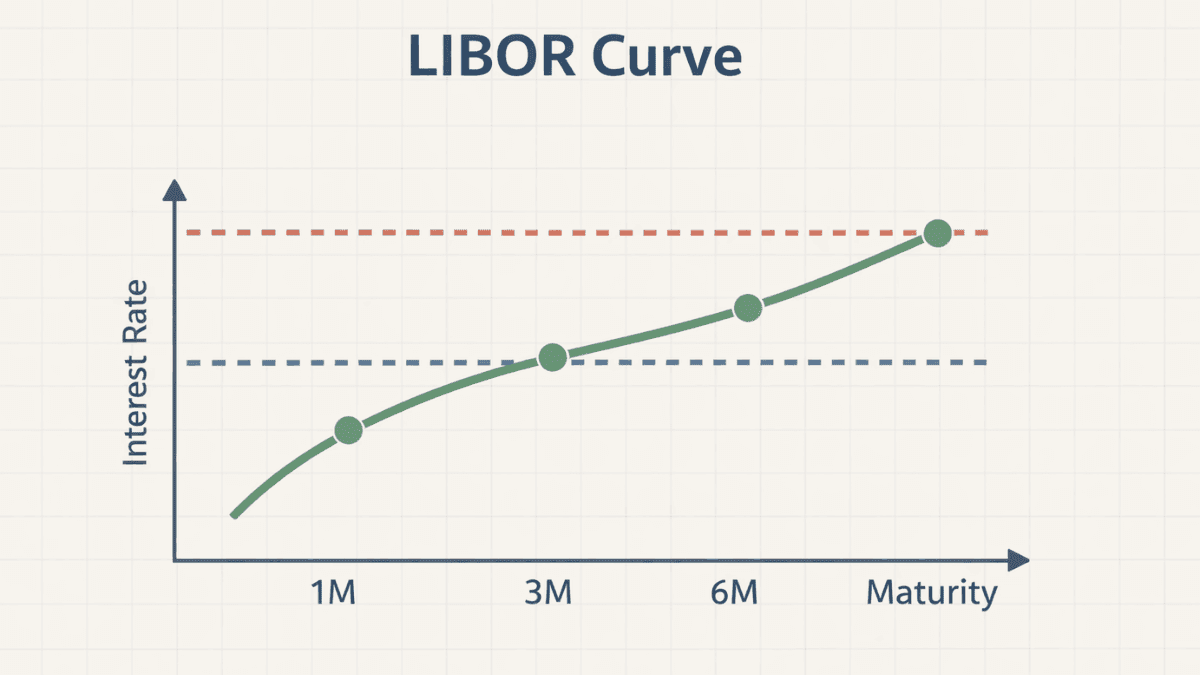
The LIBOR Curve works by plotting LIBOR rates against different time horizons. Each point on the curve represents the interest rate at which banks are willing to lend to one another for a specific duration.
The curve is built using data collected daily from major global banks. These banks submit estimates of borrowing costs, which are then averaged to produce the official LIBOR rates for different maturities.
Key Components of the Curve
The structure of the LIBOR Curve depends on several important elements:
- Maturity periods: Overnight, 1-month, 3-month, 6-month, and 12-month rates
- Market expectations: Future interest rate movements influence the curve’s shape
- Liquidity conditions: Availability of funds in the banking system impacts rates
Each of these factors contributes to how steep or flat the curve appears at any given time.
Why the LIBOR Curve Matters
The LIBOR Curve plays a central role in global finance because it influences pricing, risk management, and investment decisions. It serves as a benchmark for trillions of dollars in financial contracts.
Banks, corporations, and investors rely on it to assess borrowing costs and future rate expectations. When the curve shifts, it signals changes in market sentiment and economic conditions.
Practical Uses in Finance
The LIBOR Curve is widely used in several areas:
- Loan pricing: Adjustable-rate mortgages and corporate loans often reference LIBOR
- Derivatives valuation: Instruments like interest rate swaps depend on the curve
- Risk management: Financial institutions use it to hedge interest rate exposure
These applications make the curve a foundational tool in both banking and investment environments.
Shapes of the LIBOR Curve and What They Indicate
The shape of the LIBOR Curve provides insights into market expectations about interest rates and economic conditions. Different shapes can signal different financial outlooks.
Upward Sloping Curve
An upward-sloping curve occurs when longer-term rates are higher than short-term rates. This typically reflects expectations of economic growth and rising interest rates.
Flat Curve
A flat curve suggests little difference between short-term and long-term rates. This often indicates uncertainty or a transition phase in the economy.
Inverted Curve
An inverted curve appears when short-term rates exceed long-term rates. This is often seen as a warning sign of economic slowdown or recession.
Each shape offers valuable clues about how market participants view the future.
LIBOR Curve vs Yield Curve
While the LIBOR Curve is often compared to the broader yield curve, they are not the same. Understanding the distinction helps clarify their roles in financial analysis.
The LIBOR Curve focuses specifically on interbank lending rates, while the yield curve typically refers to government bond yields, such as those from the U.S. Treasury.
Key Differences
- Underlying instruments: LIBOR uses interbank loans; yield curves use government bonds
- Credit risk: LIBOR includes bank credit risk; Treasury yields are considered low risk
- Market use: LIBOR is common in private lending; yield curves guide macroeconomic analysis
Both curves are important, but they serve different purposes in financial decision-making.
Transition Away from LIBOR
The financial world has been moving away from LIBOR due to concerns about its reliability and transparency. This transition marks a major shift in global financial markets.
Regulators found that LIBOR was vulnerable to manipulation, which led to efforts to replace it with more robust benchmarks.
Replacement Rates
Several alternative rates have emerged to replace LIBOR:
- Secured Overnight Financing Rate (SOFR) in the United States
- Sterling Overnight Index Average (SONIA) in the United Kingdom
- Euro Short-Term Rate (€STR) in the Eurozone
These rates are based on actual transactions, making them more reliable and transparent.
How the LIBOR Curve Is Used Today
Even though LIBOR is being phased out, the concept of the LIBOR Curve remains relevant. Many legacy contracts still reference LIBOR, and understanding the curve is essential for managing these exposures.
Financial professionals also use historical LIBOR curves for analysis and comparison. They provide a benchmark for studying past interest rate environments and market behavior.
Challenges and Limitations
Despite its importance, the LIBOR Curve has several limitations that users should understand. Recognizing these helps avoid misinterpretation.
The curve is based on estimates rather than actual transactions, which can introduce inaccuracies. It also reflects bank credit risk, which may not apply to all financial instruments.
As markets evolve, these limitations have reinforced the need for more transparent and data-driven benchmarks.
Final Thoughts
The LIBOR Curve has long been a cornerstone of global finance, shaping how institutions price risk and manage interest rates. Even as the market transitions to new benchmarks, its influence remains deeply embedded in financial systems.
Understanding the LIBOR Curve provides valuable insight into how money moves between banks and how interest rates are determined. For anyone involved in finance—or simply curious about how global markets work—it remains an essential concept worth mastering.
Trade on the Go. Anywhere, Anytime
If you’re ready to apply what you’ve learned, consider trading with a globally recognized forex and CFD broker like XM .
The platform offers competitive spreads, fast execution, and access to advanced trading tools, including real-time charts and flexible account types, making it suitable for both beginners and experienced traders. Open a trading account for free and start trading today and join millions of traders and investors on the global forex market.
Trading involves risk. Ensure you understand how the markets work before investing.