The Stochastic Oscillator is one of the most popular technical indicators used by traders to understand market momentum. It helps traders identify overbought and oversold conditions, making it easier to spot potential trend reversals or continuation signals. When used correctly, it can improve timing and decision-making across forex, stocks, and cryptocurrencies.
Before diving into advanced strategies, it is important to understand what the Stochastic Oscillator is, how it works, and why traders rely on it so often.
Click here to connect with us on Telegram
What Is the Stochastic Oscillator?
The Stochastic Oscillator is a momentum indicator that compares a security’s closing price to its price range over a specific period. Instead of following the price directly, it focuses on the speed and strength of price movements. This makes it especially useful for spotting changes in momentum before price reversals happen.
The indicator was developed by George C. Lane in the 1950s. His core idea was simple: momentum changes direction before price does. This principle remains relevant in modern trading across all timeframes.
How the Stochastic Oscillator Works
To understand how the Stochastic Oscillator functions, it helps to know what it measures. The indicator assumes that in an uptrend, prices tend to close near the high of the range. In a downtrend, prices usually close near the low of the range.
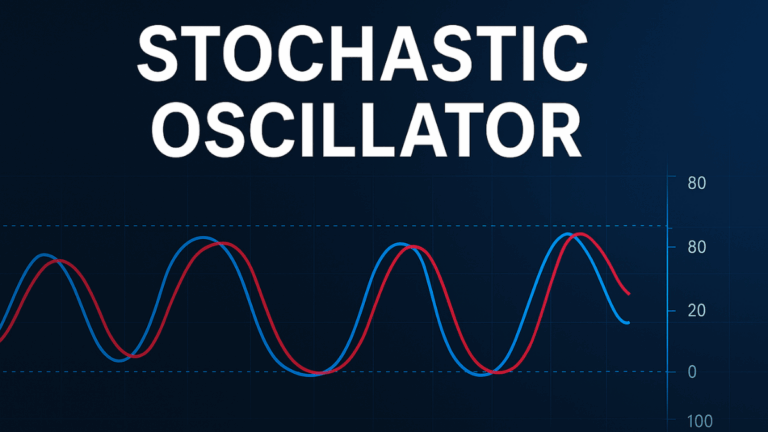
The Stochastic Oscillator is displayed as two lines that move between 0 and 100:
- %K line – the main line that reflects current momentum.
- %D line – a moving average of %K, used as a signal line.
When these lines interact, they provide signals that traders can interpret for potential entries or exits.
Understanding Overbought and Oversold Levels
One of the most common uses of the Stochastic Oscillator is identifying overbought and oversold conditions. These levels help traders assess whether price movement may be stretched too far in one direction.
Generally accepted levels include:
- Above 80 – Market is considered overbought.
- Below 20 – Market is considered oversold.
However, these levels do not mean the price will immediately reverse. Instead, they signal that momentum may be weakening, and traders should watch for confirmation before acting.
Types of Stochastic Oscillator
Before applying the indicator in real trading, it is useful to understand that there are different variations. Each version adjusts sensitivity and signal timing slightly.
Fast Stochastic
The fast stochastic responds quickly to price changes. It provides early signals but can also produce more false signals in choppy markets.
Slow Stochastic
The slow stochastic smooths out the fast version. This makes it more reliable and is the most commonly used version by traders.
Full Stochastic
The full stochastic allows traders to adjust smoothing settings manually. This flexibility makes it popular among experienced traders who want greater control.
How to Read Stochastic Oscillator Signals
Interpreting the Stochastic Oscillator correctly is key to using it effectively. The indicator provides several types of signals, each offering different insights.
Signal Line Crossovers
When the %K line crosses above the %D line, it may indicate bullish momentum. When it crosses below, it may suggest bearish momentum. These crossovers are most powerful when they occur near overbought or oversold levels.
Overbought and Oversold Signals
If the indicator moves above 80 and then falls back below it, this can signal a potential sell opportunity. Similarly, when it moves below 20 and then rises above it, a potential buy opportunity may appear.
Divergence Signals
Divergence occurs when price and the Stochastic Oscillator move in opposite directions. For example, if price makes a higher high but the oscillator makes a lower high, it may signal weakening momentum and a possible reversal.
Best Timeframes for Using the Stochastic Oscillator
The Stochastic Oscillator can be used on any timeframe, but its effectiveness depends on trading style. Short-term traders may use it on lower timeframes, while long-term traders may prefer higher timeframes.
Lower timeframes tend to produce more signals, but also more noise. Higher timeframes usually provide fewer signals, but they are often more reliable and meaningful.
Combining the Stochastic Oscillator With Other Indicators
The Stochastic Oscillator works best when combined with other tools. Using it alone may lead to false signals, especially in strong trending markets.
Common indicators used alongside it include:
- Moving averages for trend direction
- Support and resistance levels
- RSI for additional momentum confirmation
- Trendlines and chart patterns
Combining indicators helps confirm signals and reduces the risk of poor trades.
Common Mistakes Traders Make With the Stochastic Oscillator
Many traders misuse the Stochastic Oscillator because they expect it to work perfectly in all conditions. Understanding common mistakes can help improve results.
One common error is assuming that overbought means price must fall, or oversold means price must rise immediately. In strong trends, markets can remain overbought or oversold for long periods.
Another mistake is ignoring the overall trend. The Stochastic Oscillator performs best when used in the direction of the dominant trend rather than against it.
Advantages of the Stochastic Oscillator
The popularity of the Stochastic Oscillator comes from its simplicity and effectiveness. It provides clear visual signals that are easy to understand, even for beginners.
It is also versatile, working across different markets and timeframes. When combined with proper risk management, it can be a powerful addition to any trading strategy.
Limitations of the Stochastic Oscillator
Despite its strengths, the Stochastic Oscillator has limitations. It can generate false signals in sideways or highly volatile markets. This is why confirmation from other tools is always recommended.
It is also less effective in strong trending conditions if used alone. Traders should always consider market context before relying on its signals.
Final Thoughts
The Stochastic Oscillator remains one of the most trusted momentum indicators in technical analysis. Its ability to highlight momentum shifts, overbought conditions, and potential reversals makes it valuable for traders at all levels.
When used with discipline, confirmation, and proper risk management, the Stochastic Oscillator can help traders make more informed and confident trading decisions. Like all indicators, it works best as part of a complete trading system rather than as a standalone solution.