Technical Analysis is one of the most popular methods used to study financial markets. In the world of charts and price movements, technical analysis helps people understand how markets behave without relying on company financial reports. Instead, it focuses on price, trends, and market psychology.
Before exploring its tools and concepts, this guide explains the foundations in simple English so anyone can understand how it works from an educational perspective.
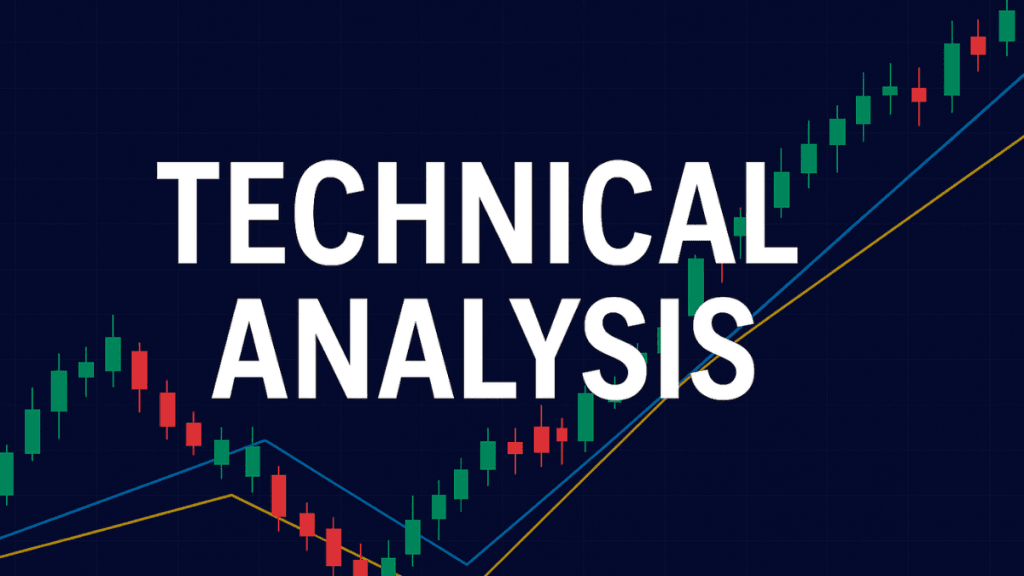
What Is Technical Analysis?
To understand the rest of this guide, it helps to know the idea behind technical analysis.
Technical analysis is a method used to study past market data—mainly price and volume—to anticipate possible future movements. It is based on the belief that market behavior often repeats because human behavior is predictable.
Every chart tells a story. Technical analysts read that story using patterns, indicators, and trends.
Why Technical Analysis Is Useful
Before diving into tools, it helps to know why technical analysis is popular.
People use it because:
- It focuses on actual market activity, not opinions.
- It can be applied to nearly any market where price moves.
- It helps explain market emotions—fear, greed, and uncertainty.
- It works in short-term and long-term analysis.
It does not guarantee results, but it gives structure to how market behavior is studied.
Core Principles of Technical Analysis
Before studying tools and indicators, it helps to understand the core ideas that technical analysis is built on.
1. Market Action Discounts Everything
This principle explains that all available information—economic reports, news, expectations—is already reflected in the price.
So, instead of trying to analyze every factor, technical analysts study price charts, which summarize the effects of all those factors.
2. Prices Move in Trends
A chart helps show whether a market is:
- Moving upward (uptrend)
- Moving downward (downtrend)
- Moving sideways (range)
Trends matter because many price movements tend to continue rather than reverse immediately.
3. History Often Repeats Itself
This idea is based on human psychology. When people fear or feel confident, they often react in similar ways as they did in the past.
This creates repeating patterns that analysts try to identify.
Main Tools Used in Technical Analysis
Before applying technical strategies, it helps to understand the tools that make technical analysis possible.
Chart Types
Understanding charts is the first step. Each chart type shows price movement differently.
1. Line Chart
This chart connects closing prices with a line.
It is simple and clean—great for beginners.
2. Bar Chart
Shows open, high, low, and close (OHLC) for each period.
It gives more detail than a line chart.
3. Candlestick Chart
One of the most popular formats.
It visually shows whether price moved up or down in a certain period and forms patterns that analysts study.
Support and Resistance
Before using indicators, it helps to understand support and resistance. They are key concepts.
Support
A price level where demand tends to stop prices from falling further.
Resistance
A price level where selling pressure tends to stop prices from rising further.
These levels help identify where markets may slow down, reverse, or continue.
Trendlines and Channels
Trendlines help identify the direction of a market. When two parallel trendlines form a path, this is called a channel.
Channels help analysts see whether price is respecting boundaries or preparing to break out.
Popular Technical Indicators
Indicators help simplify chart analysis. Below are some of the most useful ones.
1. Moving Averages (MA)
A moving average smooths price data to show the direction of a trend.
Common types:
- Simple Moving Average (SMA)
- Exponential Moving Average (EMA)
Moving averages help identify trend direction and possible turning points.
2. Relative Strength Index (RSI)
RSI measures how strong or weak recent price movements are.
It helps show whether a market might be:
- Overbought (prices rose too fast)
- Oversold (prices fell too fast)
3. Moving Average Convergence Divergence (MACD)
MACD uses two moving averages to help show momentum and possible trend changes.
It is useful for spotting slowing or strengthening market movement.
4. Bollinger Bands
These bands expand and contract based on market volatility.
When the bands tighten, it may signal a quiet market.
When they widen, volatility is increasing.
Chart Patterns in Technical Analysis
Before relying on indicators, many analysts look at chart patterns. Patterns represent crowd behavior in the market.
Reversal Patterns
Head and Shoulders
Often signals that an existing trend may be weakening.
Double Top / Double Bottom
Indicates potential trend reversal after price tests a level twice.
Continuation Patterns
Triangles
Price squeezes between two narrowing trendlines.
Flags and Pennants
Short pauses in a strong trend before it continues.
These patterns help analysts understand whether markets may continue or change direction.
Benefits of Technical Analysis
Before adopting technical analysis as a study method, it helps to understand its advantages.
- Works in many markets
- Focuses on actual price behavior
- Helps explain market emotions
- Does not require company financial data
- Can be used in different timeframes
Limitations of Technical Analysis
Just like any study method, technical analysis has limitations.
Understanding them helps avoid overconfidence.
- It cannot predict the future with certainty
- Patterns may fail during unexpected events
- Indicators can lag
- Analysis can be subjective
- Emotional decisions can still influence outcomes
Technical analysis is a tool—not a guarantee.
How to Use Technical Analysis Responsibly
Before using any analysis method, it is important to understand:
- It is for educational purposes
- Studying market behavior does not require trading
- No strategy works all the time
- Risk management and informed decision-making matter more than any single indicator
- Always combine multiple tools instead of relying on one
This helps build a balanced approach to understanding markets.
Conclusion
Technical analysis is a powerful way to study price behavior using charts, trends, and indicators.
It helps explain market psychology, simplifies complex movements, and gives structure when analyzing financial markets.
While it has limitations, it remains one of the most widely used methods to understand how markets behave.
By learning its core principles and tools, anyone can develop a clearer view of market trends and patterns.