A trendline is one of the simplest and most important tools in technical analysis, and traders use it to identify the general direction of the market. When plotted on a chart, a trendline connects significant price points, helping traders see whether the market is trending upward, downward, or moving sideways. Because of its clarity and usefulness, the trendline is often the first tool beginners learn, and the one professionals consistently rely on.
Trendlines help reveal market psychology, showing whether buyers or sellers are in control. Even though they look simple, they play a powerful role in decision-making, risk management, and timing trades.
Understanding How a Trendline Works
Before drawing any trendline, it’s important to understand what it represents. A trendline is not just a line—it’s a visual representation of momentum. It tells a story about how price behaves over time.
A proper trendline requires at least two significant price points, but it becomes more reliable when three or more points touch or respect the line. When the price reacts consistently to the line, it shows that market participants recognize it as an important level.
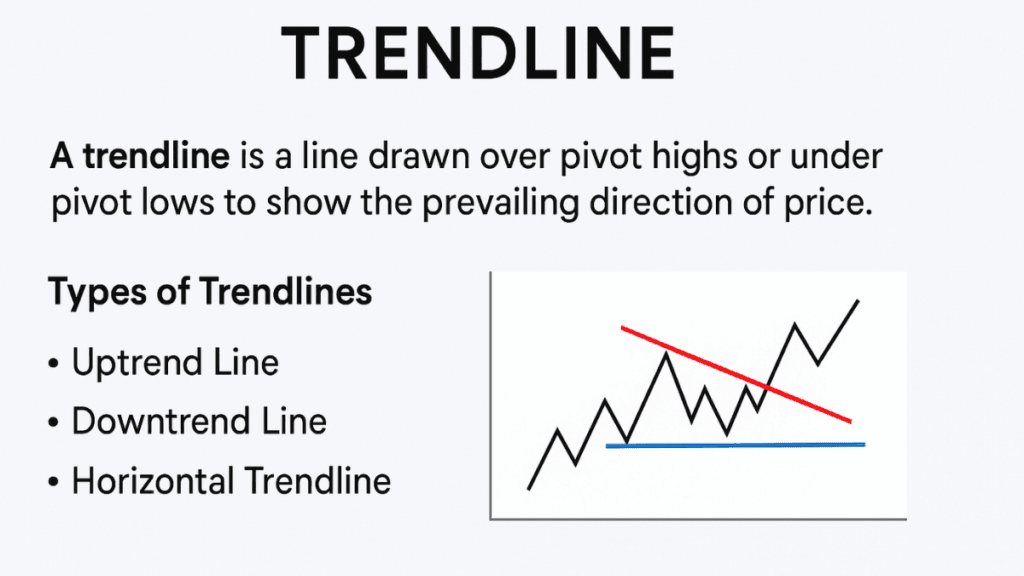
Types of Trendlines
To use a trendline effectively, you must understand the different types. Each type reveals unique information about market direction and behavior.
1. Uptrend Line (Ascending Trendline)
An uptrend line is drawn by connecting a series of higher lows. This shows that buyers are consistently stepping in at higher levels, keeping the market strong.
This type of trendline helps traders identify:
- Where to look for buying opportunities
- Where support may hold during pullbacks
2. Downtrend Line (Descending Trendline)
A downtrend line connects a sequence of lower highs. It shows sellers maintaining control and pushing prices downward.
This trendline helps traders see:
- Where selling pressure may continue
- Where resistance is likely to appear
3. Horizontal Trendline (Sideways Market)
A horizontal trendline forms when the price moves within a range, neither trending upward nor downward. It often appears during periods of market uncertainty or consolidation.
This type helps traders anticipate:
- Breakouts
- Reversals from support or resistance
How to Draw an Accurate Trendline
Many traders draw trendlines incorrectly, which leads to poor decisions. A strong trendline requires precision and consistency in how it’s drawn.
Here’s a simple way to draw a reliable trendline:
- Identify clear swing highs or swing lows.
- Connect at least two significant points.
- Avoid forcing the line to fit the price.
- Extend the line into the future to anticipate reactions.
- Adjust the trendline if new price data creates a better alignment.
Accuracy matters more than perfection. A clean, natural trendline always performs better than one drawn to match expectations.
Why Trendlines Matter in Trading
Trendlines are more than drawing tools—they are decision-making tools. They provide structure to an otherwise chaotic market.
A trendline helps traders:
- See the dominant direction of the market
- Decide whether to look for buying or selling opportunities
- Identify potential reversals or breakouts
- Manage risk with more confidence
Trendlines also reduce emotional decision-making by providing visual clarity. When the trend is clear, traders avoid guessing and focus on following the market’s direction.
Trendline as Support and Resistance
A trendline can act as both dynamic support and dynamic resistance. This makes it a valuable reference during market movements.
Trendline as Support
In an uptrend, the price often pulls back to the trendline before rising again. This reaction shows buyers defending the trend.
Trendline as Resistance
In a downtrend, the price often rises toward the trendline and then drops again. This demonstrates that sellers are maintaining control.
When price breaks through a strong trendline, it often signals a shift in the market’s direction or momentum.
Breakouts and Trendline Reversals
Trendline breakouts are important signals. They may show the end of a trend or the beginning of a new one.
A breakout becomes more meaningful when it is:
- Accompanied by strong price movement
- Supported by increased trading volume
- Confirmed by multiple timeframes
However, false breakouts do happen. This is why trendlines should be combined with other technical tools for confirmation.
Best Practices for Using Trendlines
Trendlines are simple but must be used with discipline. Applying a few best practices can significantly improve accuracy.
Some useful guidelines include:
- Always draw trendlines using major swings, not minor noise.
- Use trendlines together with indicators like moving averages.
- Check trendlines on higher timeframes for stronger reliability.
- Avoid trading only because the price touched a trendline—always confirm.
With consistent practice, trendlines reveal clear patterns that help traders act with confidence rather than emotion.
Common Mistakes Traders Make with Trendlines
Even though trendlines are straightforward, many traders misuse them. The most common mistakes include:
- Forcing the trendline to fit price movements
- Drawing trendlines from insignificant points
- Trading solely on the first touch without confirmation
- Ignoring the overall market context
Avoiding these mistakes makes your trendline analysis more objective and effective.
Final Thoughts
A trendline is one of the most valuable tools in technical analysis because it simplifies complex market movement into a clear, understandable pattern. By identifying direction, potential turning points, and areas of support or resistance, trendlines help traders make smarter and more disciplined decisions.
Although simple, the trendline remains a trusted tool used by both new traders and experienced professionals. With correct application and consistent practice, it becomes a powerful part of any trading strategy.