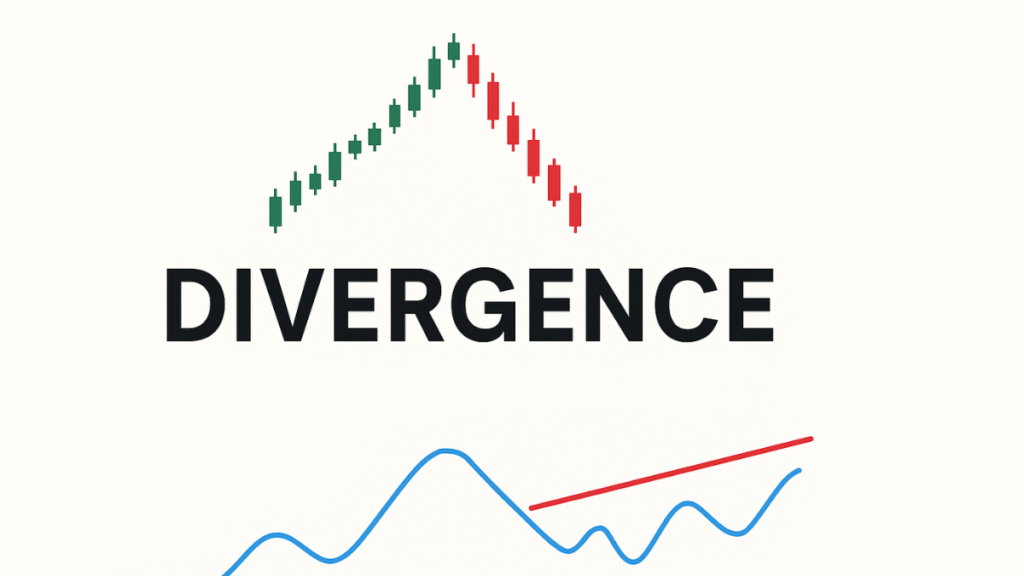
If you’ve ever felt confused by market reversals that seemed to come out of nowhere, you’re not alone. The good news is that the concept of divergence can help you spot potential turning points before they happen.
Divergence occurs when an asset’s price and a technical indicator move in opposite directions. This mismatch often reveals that the momentum behind a move is weakening or, in some cases, that the current trend still has strength to continue.
In this divergence cheat sheet, we’ll break down the two main types of divergence — regular and hidden — show you how to identify both bullish and bearish setups, and give you examples you can apply immediately on your charts.
What Is Divergence?
In technical analysis, divergence simply means that price action and an indicator (like RSI, MACD, or Stochastic) are not confirming each other.
When price makes a new high or low that isn’t confirmed by the indicator, it can signal an early warning of trend exhaustion or a possible continuation.
Divergence helps traders:
- Anticipate potential trend reversals
- Confirm trend continuation signals
- Evaluate the strength or weakness behind a move
The Two Types of Divergence
There are only two core categories you need to remember:
1. Regular Divergence – Signals Possible Trend Reversal
This type of divergence suggests the trend may soon reverse direction.
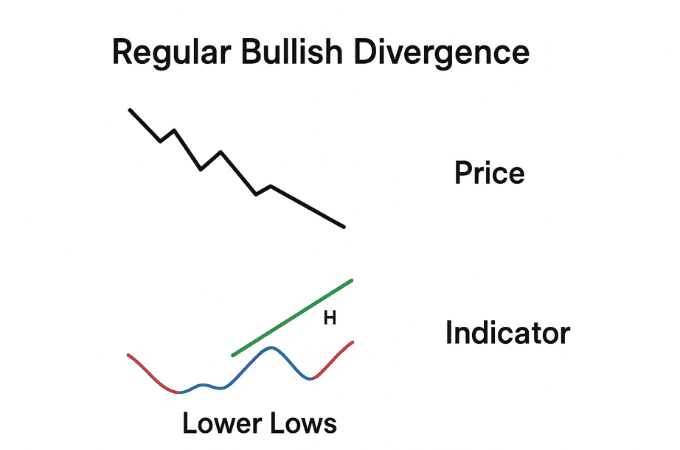
Regular Bullish Divergence
- Price: Makes Lower Lows (LL)
- Indicator: Makes Higher Lows (HL)
- Meaning: Selling pressure is weakening, and a bullish reversal might be near.
- Common in: Downtrends nearing reversal points
🟢 Example:
Price falls to new lows, but RSI or Stochastic forms higher lows. Momentum is slowing down, hinting that buyers are returning.
(Place your image here — the one you uploaded earlier showing “Lower Lows” on price and “Higher Low” on the indicator.)
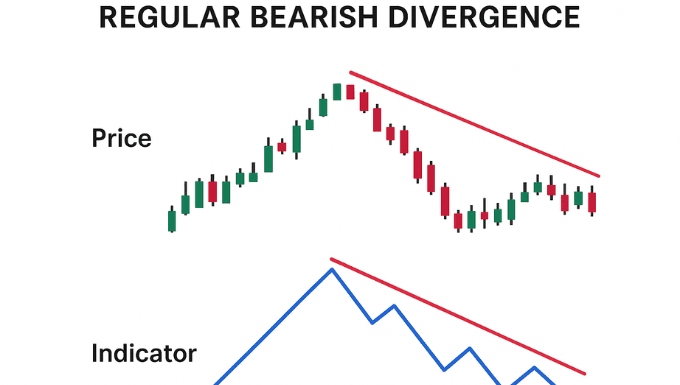
Regular Bearish Divergence
- Price: Makes Higher Highs (HH)
- Indicator: Makes Lower Highs (LH)
- Meaning: Uptrend momentum is fading, warning of a possible bearish reversal.
- Common in: Extended uptrends before pullbacks
🔴 Example:
Price pushes to new highs, but RSI starts forming lower highs. This suggests buying pressure is fading and sellers may take control.
2. Hidden Divergence – Signals Trend Continuation
Hidden divergence occurs during a pullback inside an existing trend. Instead of warning of a reversal, it indicates that the trend is likely to continue.
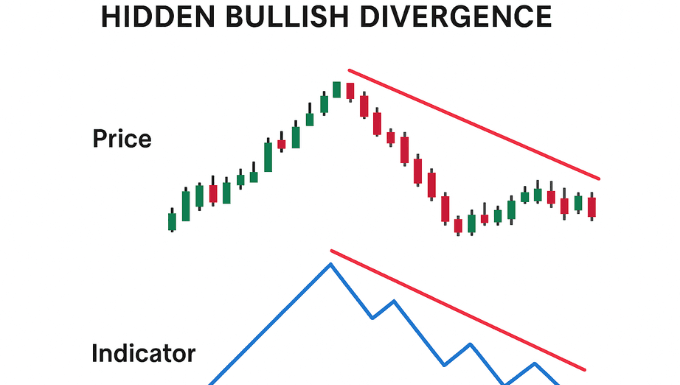
Hidden Bullish Divergence
- Price: Makes Higher Low (HL)
- Indicator: Makes Lower Low (LL)
- Meaning: The pullback is temporary, and the uptrend is likely to continue.
- Common in: Healthy uptrends where price is correcting before continuing upward
🟢 Example:
Price creates a higher low, but RSI dips to a lower low. The market is reloading strength for the next move up.
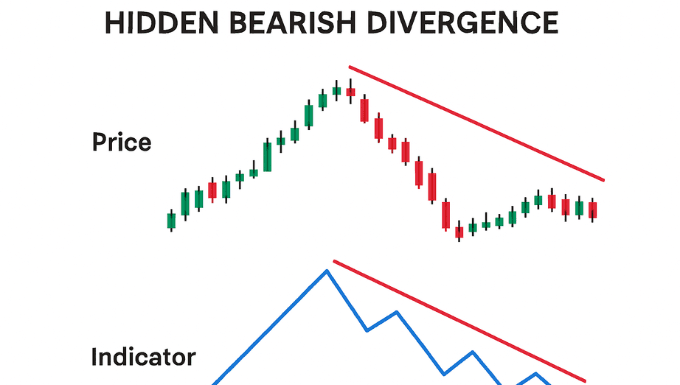
Hidden Bearish Divergence
- Price: Makes Lower High (LH)
- Indicator: Makes Higher High (HH)
- Meaning: The pullback is temporary, and the downtrend is likely to continue.
- Common in: Ongoing downtrends where price is correcting upward before falling further
🔴 Example:
Price makes a lower high, but MACD or Stochastic forms a higher high — a sign sellers are still in control.
Best Indicators for Spotting Divergence
Divergence can appear with many indicators, but it works best with momentum oscillators. Here are the top four:
- RSI (Relative Strength Index) – Simple and reliable for both regular and hidden divergences.
- MACD (Moving Average Convergence Divergence) – Excellent for visualizing momentum shifts between moving averages.
- Stochastic Oscillator – Ideal for catching early turning points in ranging markets.
- CCI (Commodity Channel Index) – Measures variation from the statistical mean, often used in trending markets.
How to Confirm Divergence Signals
While divergence can be powerful, it should never be used alone. To confirm reliability:
- Combine with support/resistance levels or trendlines.
- Watch for candlestick patterns (e.g., engulfing, pin bar) around divergence zones.
- Observe volume behavior — rising volume on reversal confirms conviction.
- Use higher timeframes for stronger, less noisy signals.
Common Mistakes to Avoid
- Trading every divergence — Some are weak and occur in consolidation zones.
- Ignoring market context — Fundamental events can override technical signals.
- Forcing divergence — Only act on clearly visible pivot points.
- No stop-loss — Even perfect divergence setups can fail; protect capital.
- Overcomplicating indicators — One or two are enough; clarity beats clutter.
Divergence Cheat Sheet Summary
| Type | Price Action | Indicator | Bias | Signal Type |
| Regular Bullish | Lower Lows | Higher Lows | Bullish | Reversal |
| Regular Bearish | Higher Highs | Lower Highs | Bearish | Reversal |
| Hidden Bullish | Higher Lows | Lower Lows | Bullish | Continuation |
| Hidden Bearish | Lower Highs | Higher Highs | Bearish | Continuation |
Trading Example Workflow
Let’s say you’re watching EUR/USD on the 4-hour chart using RSI:
- Identify price making lower lows but RSI showing higher lows.
- Draw a bullish trendline on the RSI.
- Wait for price to break above a short-term resistance.
- Enter a long position.
- Set stop-loss below the recent swing low.
- Take profit at the next resistance or use trailing stops.
This method adds structure, confirmation, and confidence to your divergence trades.
Final Thoughts
Understanding divergence gives traders an edge in reading momentum and recognizing when markets are losing strength or preparing to resume a trend.
Keep this Divergence Cheat Sheet handy as a visual reminder:
- Regular Divergence = Reversal
- Hidden Divergence = Continuation
Combine this knowledge with sound risk management, confirmation tools, and patience — and divergence will become one of your most reliable signals.
Vincent Nyagaka is the founder of Chweya, where he breaks down complex financial topics into simple insights. A trader since 2015, he uses his market experience to help readers better understand investing, trading, and personal finance.
