The Bullish Belt Hold is one of the most interesting single-candlestick reversal patterns in technical analysis. Traders often use it to spot potential trend reversals after a market has been falling. While it may look simple at first glance, the pattern can reveal strong buying pressure and shifting market sentiment when it appears in the right conditions.
If you trade forex, stocks, cryptocurrencies, or indices, understanding the Bullish Belt Hold can help you identify possible bullish turning points before larger price moves begin. The key is knowing what the pattern really means, how to confirm it, and when to avoid false signals.
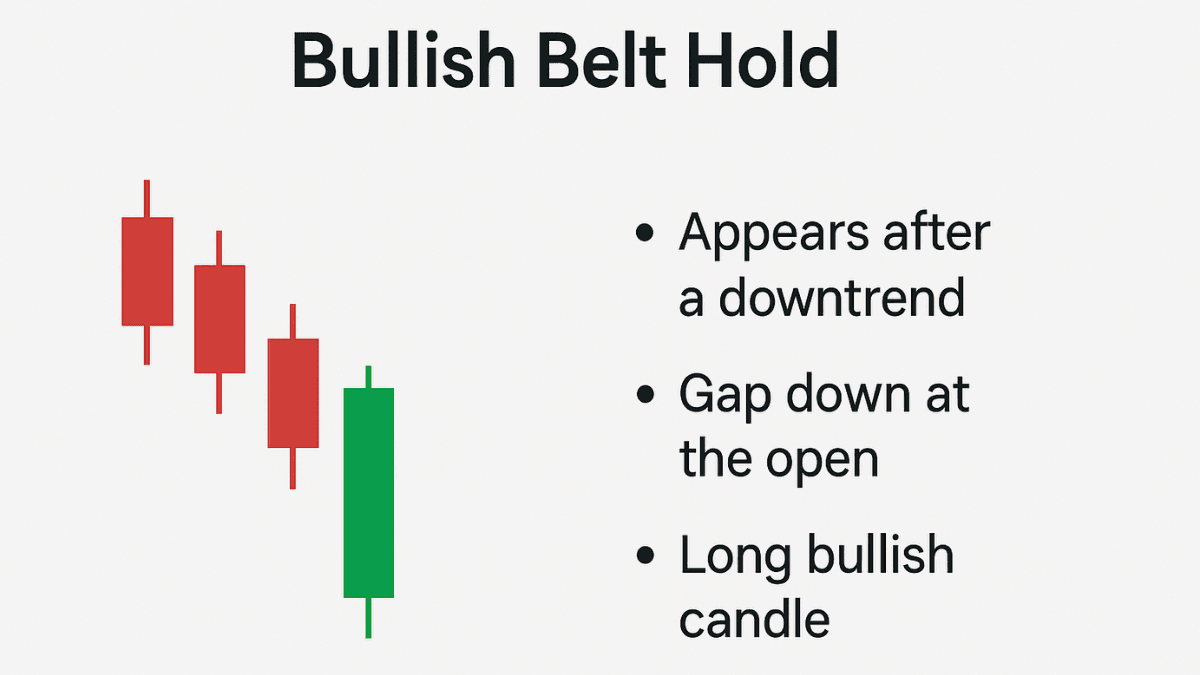
What Is a Bullish Belt Hold?
The Bullish Belt Hold is a single bullish candlestick pattern that usually appears after a downtrend. This candlestick opens near its low and then pushes strongly upward throughout the session, closing near the high of the candle.
The pattern visually shows buyers taking control after sellers previously dominated the market. Many traders view it as an early sign that bearish momentum may be weakening.
A classic Bullish Belt Hold candle has several characteristics:
- A long bullish body
- Little or no lower wick
- A close near the candle’s high
- Formation after a downward move
The candle often looks aggressive because the price opens low and buyers immediately drive the market upward without allowing sellers much control.
Why the Bullish Belt Hold Matters
The Bullish Belt Hold matters because it reflects a sudden shift in market psychology. In bearish conditions, sellers usually remain in control. When this pattern appears, it suggests buyers entered aggressively and absorbed selling pressure.
That behavior change can sometimes trigger larger reversals. Institutional traders and experienced technical analysts often pay attention to strong bullish candles appearing at major support zones or after extended declines.
The pattern becomes even more important when combined with:
- Strong support levels
- Oversold indicators
- High trading volume
- Trend exhaustion signs
- Divergence on RSI or MACD
A Bullish Belt Hold alone is not enough to guarantee a reversal. Context is what gives the pattern meaning.
How the Bullish Belt Hold Forms
To understand the Bullish Belt Hold properly, it helps to break down the formation process step by step.
Sellers Control the Market First
Before the pattern appears, the market is usually moving lower. Traders may already be bearish, and momentum often favors sellers.
This creates fear or uncertainty in the market. Many traders expect the downtrend to continue.
Price Opens Near the Low
The Bullish Belt Hold starts with a low opening price. Sometimes the candle opens with a small gap down in stock markets, though gaps are less common in forex.
At this stage, sellers still appear strong.
Buyers Suddenly Take Control
Instead of continuing lower, buyers step in aggressively. Price begins climbing steadily throughout the trading session.
The absence of a significantly lower wick shows sellers could not push the price meaningfully below the opening level.
The Candle Closes Strong
The candle closes near its high, leaving a large bullish body. This strong finish often signals renewed buyer confidence.
The result is a visually powerful bullish candle that stands out from recent bearish candles.
Bullish Belt Hold vs Other Candlestick Patterns
Many traders confuse the Bullish Belt Hold with other bullish reversal patterns. Understanding the differences helps avoid poor analysis.
Bullish Belt Hold vs Hammer
A Hammer candle has a long lower wick and a small body near the top of the candle. It shows sellers pushed the price lower before buyers recovered.
The Bullish Belt Hold is different because it has little or no lower wick. Buyers remain dominant almost immediately after the open.
Bullish Belt Hold vs Bullish Engulfing
A Bullish Engulfing pattern uses two candles. The second bullish candle fully engulfs the previous bearish candle.
The Bullish Belt Hold only requires one candle. Its strength comes from the large bullish body and strong upward movement.
Bullish Belt Hold vs Marubozu
A bullish Marubozu candle also has little or no wicks. The difference is context.
A Bullish Belt Hold specifically appears after a downtrend and acts as a reversal signal. A Marubozu can appear anywhere in the trend.
How to Trade the Bullish Belt Hold Pattern
Trading the Bullish Belt Hold effectively requires more than simply buying after the candle forms. Smart traders look for confirmation and favorable market conditions.
Bullish Belt Hold Trading Strategy
This section explains how traders typically approach entries, confirmations, and risk management when using the Bullish Belt Hold pattern.
Identify a Clear Downtrend
The pattern works best after noticeable bearish movement. If the market is already ranging sideways, the signal becomes less reliable.
Look for lower highs and lower lows before the pattern forms.
Wait for the Pattern to Close
Never assume the candle will remain bullish before it closes. Market conditions can change rapidly.
Professional traders usually wait for the full candle to complete before making decisions.
Look for Confirmation
Confirmation reduces the risk of false reversals. Common confirmation methods include:
- A bullish candle closing above the Bullish Belt Hold high
- Increased trading volume
- RSI moving out of oversold territory
- MACD bullish crossover
- Break of short-term resistance
The more confirmation signals align, the stronger the setup may become.
Place a Stop Loss Properly
Risk management is critical. Many traders place their stop loss below the low of the Bullish Belt Hold candle.
This approach limits downside if the pattern fails.
Set Realistic Profit Targets
Profit targets should match market structure rather than random percentages.
Some traders target:
- Previous resistance zones
- Fibonacci retracement levels
- Risk-to-reward ratios like 1:2 or 1:3
- Moving average resistance
Best Markets for Trading the Bullish Belt Hold
The Bullish Belt Hold can appear in almost every financial market. Still, some markets produce cleaner setups than others.
Forex Market
Forex traders commonly use the pattern on major pairs like EUR/USD, GBP/USD, and USD/JPY.
Because forex trades 24 hours a day, confirmation becomes especially important since gaps are less common than in stock markets.
Stock Market
The pattern tends to work well in stocks because opening gaps often make reversal candles more meaningful.
Strong Bullish Belt Holds near earnings support or major demand zones can attract institutional buying.
Cryptocurrency Market
Crypto traders also use the pattern on Bitcoin, Ethereum, and altcoins. Volatility in crypto can create large bullish candles that resemble Bullish Belt Holds.
Still, crypto markets generate more false breakouts, so confirmation matters even more.
Common Mistakes Traders Make
Many beginners misuse the Bullish Belt Hold because they focus only on candle shape while ignoring broader market conditions.
Understanding common mistakes can improve decision-making significantly.
Trading Without Confirmation
A single bullish candle is not enough reason to enter blindly. Markets often produce temporary rebounds during strong downtrends.
Waiting for confirmation helps filter weak setups.
Ignoring Market Structure
A Bullish Belt Hold inside a major bearish trend may only produce a short-term bounce instead of a full reversal.
Always analyze higher timeframes before entering trades.
Using Tight Stop Losses
Markets naturally fluctuate. Extremely tight stops often get triggered before the price moves in the intended direction.
Traders should give the setup reasonable breathing room.
Overtrading Every Pattern
Not every Bullish Belt Hold is worth trading. Quality matters more than quantity.
The best setups usually appear near strong support levels or after emotional selloffs.
How Volume Strengthens the Pattern
Volume can significantly improve the reliability of a Bullish Belt Hold.
When the bullish candle forms with unusually high volume, it suggests genuine buying interest rather than random price movement. Institutions and larger market participants often leave clues through increased volume activity.
Low-volume Bullish Belt Holds are generally weaker because they may lack conviction.
Combining Bullish Belt Hold With Indicators
Experienced traders rarely depend on candlestick patterns alone. Combining the Bullish Belt Hold with technical indicators can improve accuracy.
Popular combinations include:
- RSI for oversold conditions
- MACD for momentum shifts
- Moving averages for trend direction
- Fibonacci retracement levels
- Support and resistance analysis
For example, a Bullish Belt Hold forming at a 61.8% Fibonacci retracement level with RSI divergence may provide a much stronger setup than the candle alone.
Is the Bullish Belt Hold Reliable?
The Bullish Belt Hold can be reliable when used correctly, but no candlestick pattern guarantees success.
Its reliability depends heavily on:
- Market context
- Trend conditions
- Confirmation signals
- Risk management
- Timeframe selection
On higher timeframes like the daily or weekly chart, the pattern often carries more weight than on lower timeframes such as the 1-minute or 5-minute chart.
Patience also matters. Some traders lose money because they force trades in weak conditions instead of waiting for high-quality setups.
Final Thoughts
The Bullish Belt Hold is a powerful candlestick reversal pattern that reflects sudden buyer strength after bearish market pressure. When it forms in the right environment, it can help traders identify early reversal opportunities across forex, stocks, and cryptocurrency markets.
Still, the pattern works best as part of a broader trading strategy rather than a standalone signal. Confirmation, market structure, volume analysis, and disciplined risk management all play major roles in long-term trading success.
If you learn to combine the Bullish Belt Hold with proper technical analysis, you can improve your ability to spot higher-probability bullish reversals and avoid many common beginner mistakes.
Trade on the Go. Anywhere, Anytime
If you’re ready to apply what you’ve learned, consider trading with a globally recognized forex and CFD broker like XM .
The platform offers competitive spreads, fast execution, and access to advanced trading tools, including real-time charts and flexible account types, making it suitable for both beginners and experienced traders. Open a trading account for free and start trading today and join millions of traders and investors on the global forex market.
Trading involves risk. Ensure you understand how the markets work before investing.