Fibonacci Retracement is a popular technical analysis tool used by traders to identify possible support and resistance levels during price pullbacks. It is based on the famous Fibonacci sequence, and many traders rely on it to plan entries, exits, and risk management.
What Is Fibonacci Retracement?
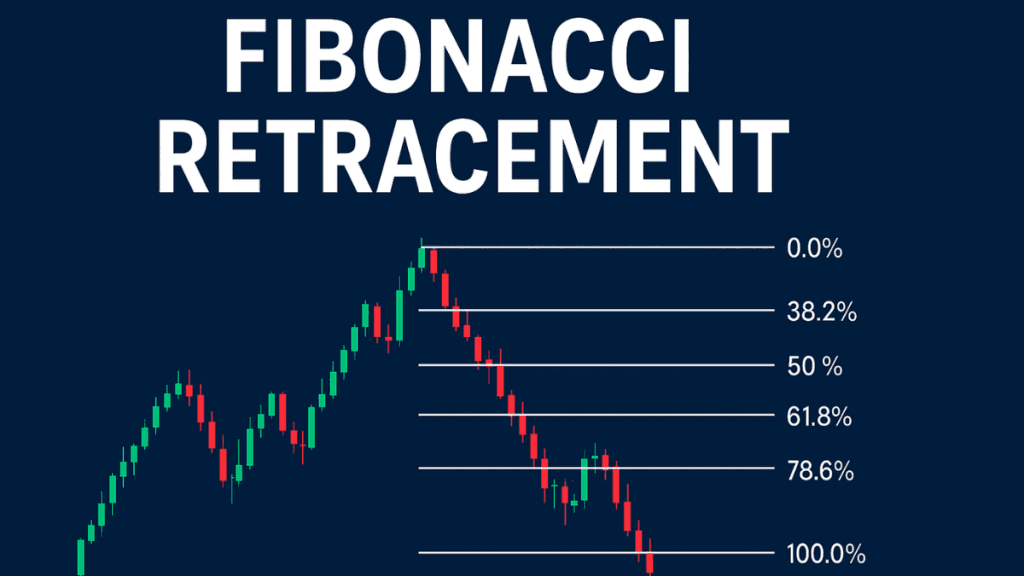
Fibonacci Retracement is a method of plotting horizontal lines on a price chart to show potential reversal levels. These levels are calculated using key ratios derived from the Fibonacci sequence, such as 23.6%, 38.2%, 50%, 61.8%, and 78.6%.
When the price moves strongly in one direction and then pulls back, traders use these levels to estimate where the pullback might end before the trend continues.
Where the Fibonacci Ratios Come From
The Fibonacci sequence is a series of numbers where each number equals the sum of the previous two.
Example: 0, 1, 1, 2, 3, 5, 8, 13…
Important ratios come from dividing numbers in the sequence:
- 61.8% comes from dividing a number by the next one in the sequence.
- 38.2% comes from dividing a number by the one two places ahead.
- 23.6% comes from dividing a number by the one three places ahead.
Although these ratios come from mathematics, traders use them because they often appear in natural patterns, chart movements, and human behavior.
How Fibonacci Retracement Works in Trading
To use Fibonacci Retracement, traders identify two key price points:
- A major swing high
- A major swing low
The Fibonacci tool then creates levels between these two points.
These levels act as possible areas where price may pause, reverse, or continue the trend.
Example
If a currency pair rises from 1.0000 to 1.1000, the retracement levels will be plotted between these points:
- 23.6%
- 38.2%
- 50%
- 61.8%
- 78.6%
Traders then watch how the price reacts at each level.
The Most Important Fibonacci Retracement Levels
1. 38.2% Retracement
A common level for shallow pullbacks.
Signals a strong trend continuation.
2. 50% Retracement
Not a true Fibonacci number, but widely used.
Suggests a balanced retracement before continuation.
3. 61.8% Retracement
The most important level is known as the Golden Ratio.
If the price bounces from this zone, a trend continuation is highly likely.
4. 78.6% Retracement
A deep pullback level.
Often used when the trend is weaker but not broken.
Why Traders Use Fibonacci Retracement
Traders use Fibonacci Retracement because it helps them:
- Identify likely support and resistance zones
- Plan entries during a pullback
- Set stop-loss and take-profit levels
- Understand market psychology
- Avoid entering at the top or bottom of a move
These levels work well in trending markets and help traders avoid emotional decisions.
How to Draw Fibonacci Retracement on a Chart
Here is the simple process:
Step 1: Identify the Trend
Determine whether the market is in an uptrend or a downtrend.
Step 2: Choose the Swing High and Swing Low
- In an uptrend, draw from the swing low to high.
- In a downtrend, draw from the swing high to low.
Step 3: Mark the Fibonacci Levels
The tool will automatically display the retracement percentages.
Step 4: Watch Market Reaction
Price may:
- Bounce off a level
- Pause at a level
- Break through and move to the next level
Your job is to observe and confirm signals before entering a trade.
Fibonacci Retracement Trading Strategies
1. Trend Continuation Strategy
This is the most common use.
- Wait for the trend to pull back.
- Look for a bounce at 38.2%, 50%, or 61.8%.
- Enter when candlestick patterns or volume confirm the move.
Works best in strong trends.
2. Combining Fibonacci With Support and Resistance
If a Fibonacci level aligns with a previous support or resistance zone, it becomes stronger.
This is known as confluence, and traders trust it more.
3. Using Fibonacci With Moving Averages
When a key moving average (like the 50-day or 200-day MA) sits near a Fibonacci level, it gives a stronger signal.
4. Fibonacci + Trendline Setup
A retracement level meeting a trendline adds more confirmation and reduces false signals.
Fibonacci Retracement Limitations
Although powerful, Fibonacci Retracement has weaknesses:
- It does not tell you the exact reversal point
- It may give false signals in sideways markets
- It works poorly during news or high volatility
- It requires confirmation from other indicators
The tool should be used with price action, trend analysis, or other indicators for accuracy.
Common Mistakes Traders Make With Fibonacci Retracement
Many beginners misuse the tool. Here are common errors:
- Drawing levels on small or random price swings
- Ignoring the overall trend
- Trading solely based on one Fibonacci level
- Not waiting for confirmation
- Using the tool in a flat or choppy market
Avoid these mistakes to improve your results.
Best Markets Where Fibonacci Retracement Works
Fibonacci Retracement can be used in:
- Forex
- Commodities
- Stocks
- Indices
- Cryptocurrencies
- Metals
It works best in markets with clear trends and predictable price swings.
Is Fibonacci Retracement Reliable?
Fibonacci Retracement is not a guarantee, but it is a powerful guide.
Most professional traders use it because it gives structure to the market and helps control risk.
When combined with other tools, it becomes one of the most effective methods of reading pullbacks.
Final Thoughts
Fibonacci Retracement remains one of the simplest yet most useful tools in technical analysis. It helps traders identify likely turning points, spot entry opportunities, and manage trades with more confidence. When used with price action and trend direction, it can significantly improve your trading decisions.
If you want to master chart reading, Fibonacci Retracement is a great place to start.